A simple index of "information" content associated with individuals in a SoilProfileCollection object. Information content is quantified by number of bytes after compression via memCompress().
Usage
profileInformationIndex(
  x,
  vars,
  method = c("joint", "individual"),
  baseline = FALSE,
  numericDigits = 8,
  padNA = FALSE,
  scaleNumeric = FALSE,
  compression = "gzip"
)
Arguments
- x
SoilProfileCollectionobject- vars
character vector of site or horizon level attributes to consider
- method
character, 'individual' or 'joint' complexity
- baseline
logical, compute ratio to "baseline" information content, see details
- numericDigits
integer, number of significant digits to retain in numeric -> character conversion
- padNA
logical, pad depths to
max(x), supplied todice(fill = padNA)- scaleNumeric
logical,
scale()each numeric variable, causing "profile information" to vary based on other profiles in the collection- compression
character, compression method as used by
memCompress(): 'gzip', 'bzip2', 'xz', 'none'
Value
a numeric vector of the same length as length(x) and in the same order, suitable for direct assignment to a new site-level attribute
Details
Information content via compression (gzip) is the central assumption behind this function: the values associated with a simple soil profile having few horizons and little variation between horizons (isotropic depth-functions) will compress to a much smaller size than a complex profile (many horizons, strong anisotropy). Information content is evaluated a profile at a time, over each site or horizon level attribute specified in vars. The baseline argument invokes a comparison to the simplest possible representation of each depth-function:
numeric: replication of the mean value to match the number of horizons with non-NA valuescharacterorfactor: replication of the most frequent value to match the number of horizons with non-NA values
The ratios computed against a "simple" baseline represent something like "information gain". Larger baseline ratios suggest more complexity (more information) associated with a soil profile's depth-functions. Alternatively, the total quantity of information (in bytes) can be determined by setting baseline = FALSE.
Examples
# single horizon, constant value
p1 <- data.frame(id = 1, top = 0, bottom = 100, p = 5, name = 'H')
# multiple horizons, constant value
p2 <- data.frame(
id = 2, top = c(0, 10, 20, 30, 40, 50),
bottom = c(10, 20, 30, 40, 50, 100),
p = rep(5, times = 6),
name = c('A1', 'A2', 'Bw', 'Bt1', 'Bt2', 'C')
)
# multiple horizons, random values
p3 <- data.frame(
id = 3, top = c(0, 10, 20, 30, 40, 50),
bottom = c(10, 20, 30, 40, 50, 100),
p = c(1, 5, 10, 35, 6, 2),
name = c('A1', 'A2', 'Bw', 'Bt1', 'Bt2', 'C')
)
# multiple horizons, mostly NA
p4 <- data.frame(
id = 4, top = c(0, 10, 20, 30, 40, 50),
bottom = c(10, 20, 30, 40, 50, 100),
p = c(1, NA, NA, NA, NA, NA),
name = c('A1', 'A2', 'Bw', 'Bt1', 'Bt2', 'C')
)
# shallower version of p1
p5 <- data.frame(id = 5, top = 0, bottom = 50, p = 5, name = 'H')
# combine and upgrade to SPC
z <- rbind(p1, p2, p3, p4, p5)
depths(z) <- id ~ top + bottom
hzdesgnname(z) <- 'name'
z <- fillHzGaps(z)
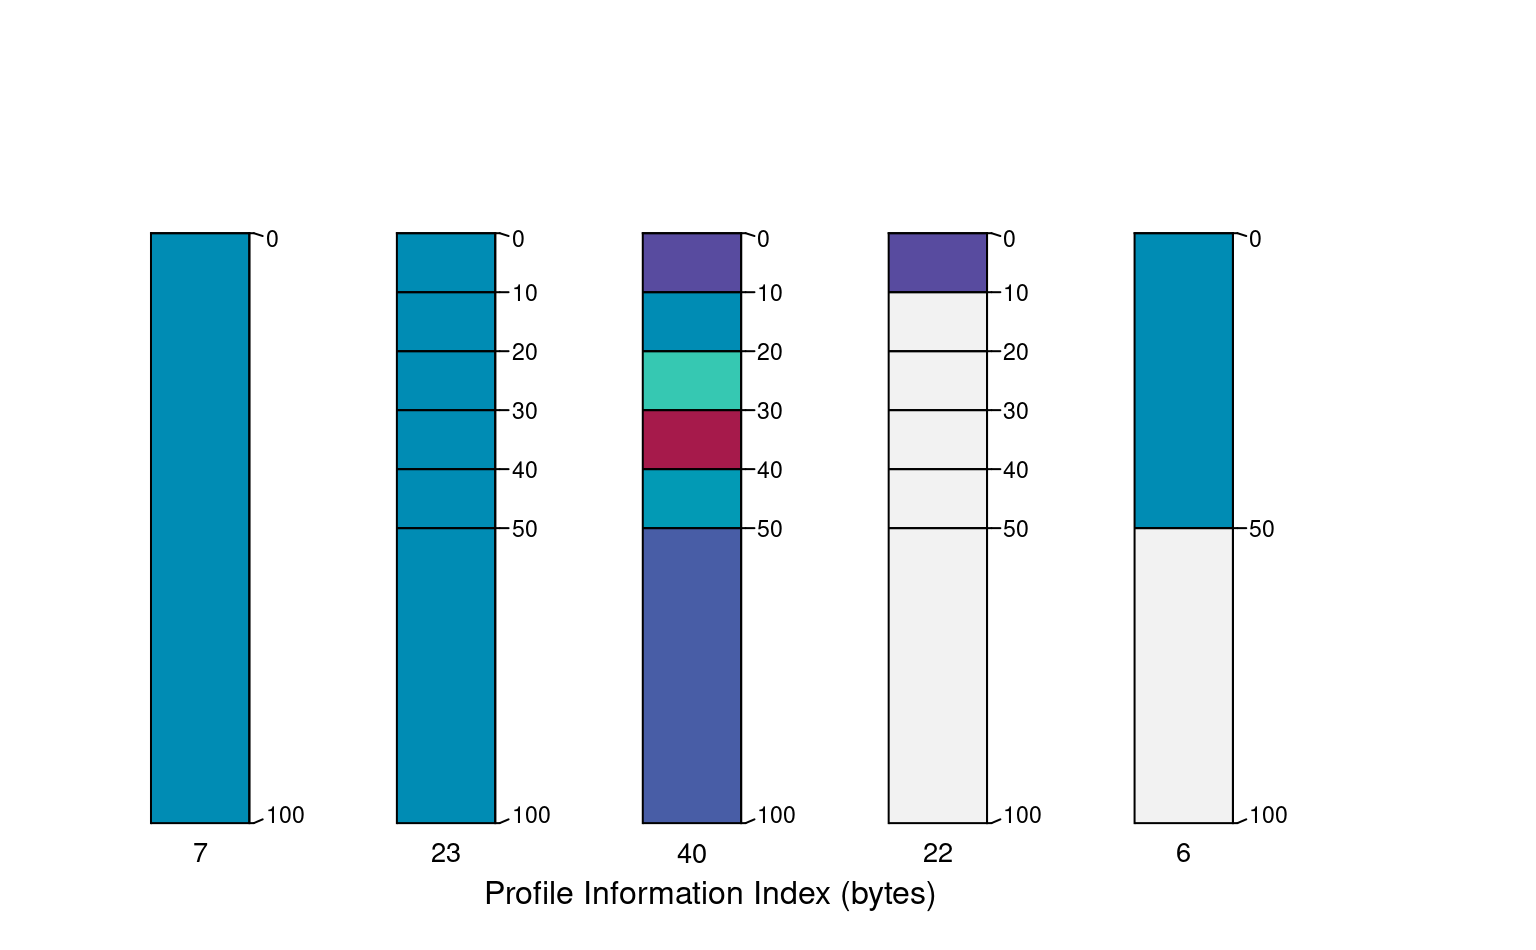
# visual check
par(mar = c(1, 0, 3, 3))
plotSPC(z, color = 'p', name.style = 'center-center', cex.names = 0.8, max.depth = 110)
# factor version of horizon name
z$fname <- factor(z$name)
vars <- c('p', 'name')
# result is total bytes
pi <- profileInformationIndex(z, vars = vars, method = 'joint', baseline = FALSE)
text(x = 1:5, y = 105, labels = pi, cex = 0.85)
mtext('Profile Information Index (bytes)', side = 1, line = -1)