Iterate over profiles in a SoilProfileCollection
Source:R/SoilProfileCollection-iterators.R
profileApply.RdIterate over all profiles in a SoilProfileCollection, calling FUN on a single-profile SoilProfileCollection for each step.
Usage
# S4 method for class 'SoilProfileCollection'
profileApply(
  object,
  FUN,
  simplify = TRUE,
  frameify = FALSE,
  chunk.size = 100,
  column.names = NULL,
  APPLY.FUN = lapply,
  ...
)
Arguments
- object
a SoilProfileCollection
- FUN
a function to be applied to each profile within the collection
- simplify
logical, should the result be simplified to a vector? default: TRUE; see examples
- frameify
logical, should the result be collapsed into a data.frame? default: FALSE; overrides simplify argument; see examples
- chunk.size
numeric, size of "chunks" for faster processing of large SoilProfileCollection objects; default: 100
- column.names
character, optional character vector to replace frameify-derived column names; should match length of colnames() from FUN result; default: NULL
- APPLY.FUN
function, optional alternate
lapply()-like function for processing chunks. For examplefuture.apply::future_lapply()for processing chunks in parallel. Defaultbase::lapply().- ...
additional arguments passed to FUN
Value
When simplify is TRUE, a vector of length nrow(object) (horizon data) or of length length(object) (site data). When simplify is FALSE, a list is returned. When frameify is TRUE, a data.frame is returned. An attempt is made to identify idname and/or hzidname in the data.frame result, safely ensuring that IDs are preserved to facilitate merging profileApply result downstream.
Examples
data(sp1)
depths(sp1) <- id ~ top + bottom
# estimate soil depth using horizon designations
profileApply(sp1, estimateSoilDepth, name='name')
#> P001 P002 P003 P004 P005 P006 P007 P008 P009
#> 89 59 67 62 68 200 233 200 240
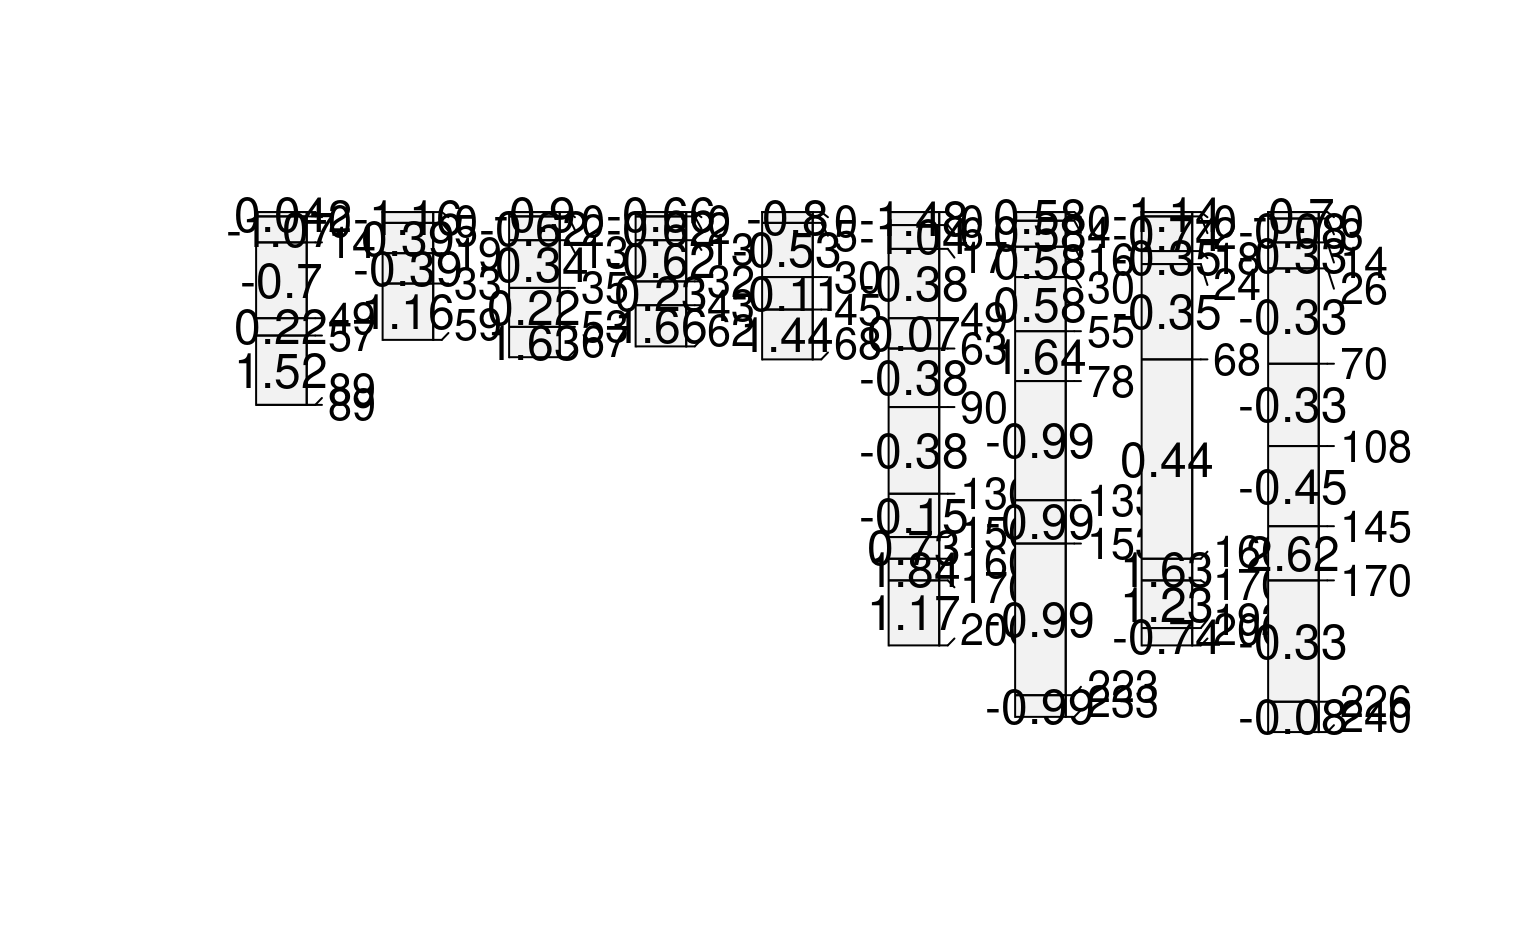
# scale a single property 'prop' in horizon table
# scaled = (x - mean(x)) / sd(x)
sp1$d <- profileApply(sp1, FUN=function(x) round(scale(x$prop), 2))
plot(sp1, name='d')
#> [P001:6] horizon with top == bottom, cannot fix horizon depth overlap
#> consider using repairMissingHzDepths()
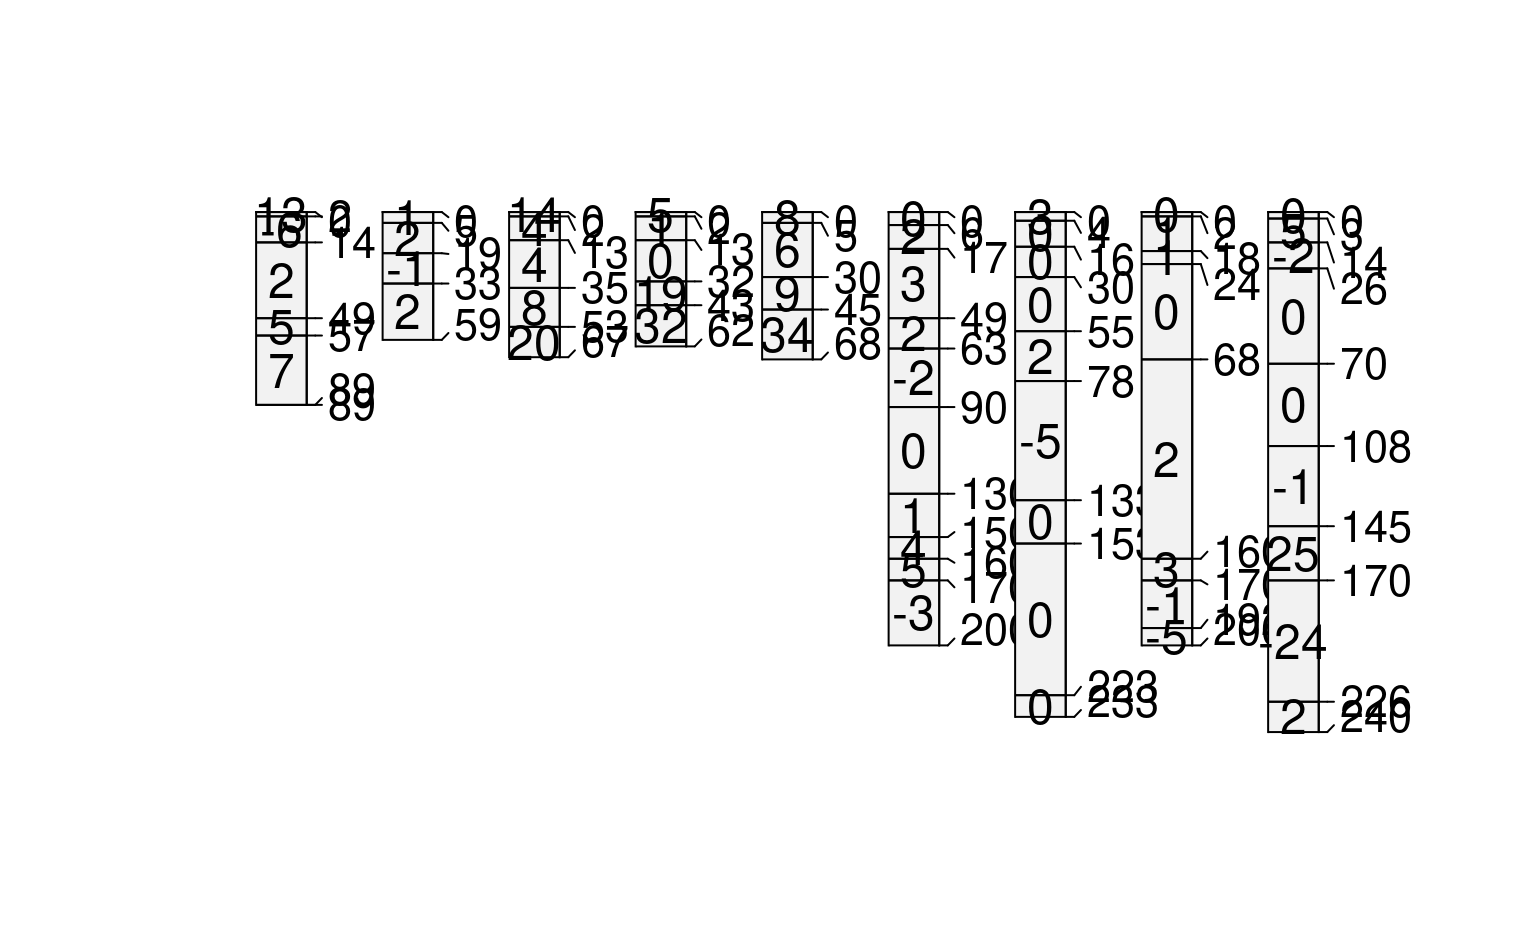
 # compute depth-wise differencing by profile
# note that our function expects that the column 'prop' exists
f <- function(x) { c(x$prop[1], diff(x$prop)) }
sp1$d <- profileApply(sp1, FUN=f)
plot(sp1, name='d')
#> [P001:6] horizon with top == bottom, cannot fix horizon depth overlap
#> consider using repairMissingHzDepths()
# compute depth-wise differencing by profile
# note that our function expects that the column 'prop' exists
f <- function(x) { c(x$prop[1], diff(x$prop)) }
sp1$d <- profileApply(sp1, FUN=f)
plot(sp1, name='d')
#> [P001:6] horizon with top == bottom, cannot fix horizon depth overlap
#> consider using repairMissingHzDepths()
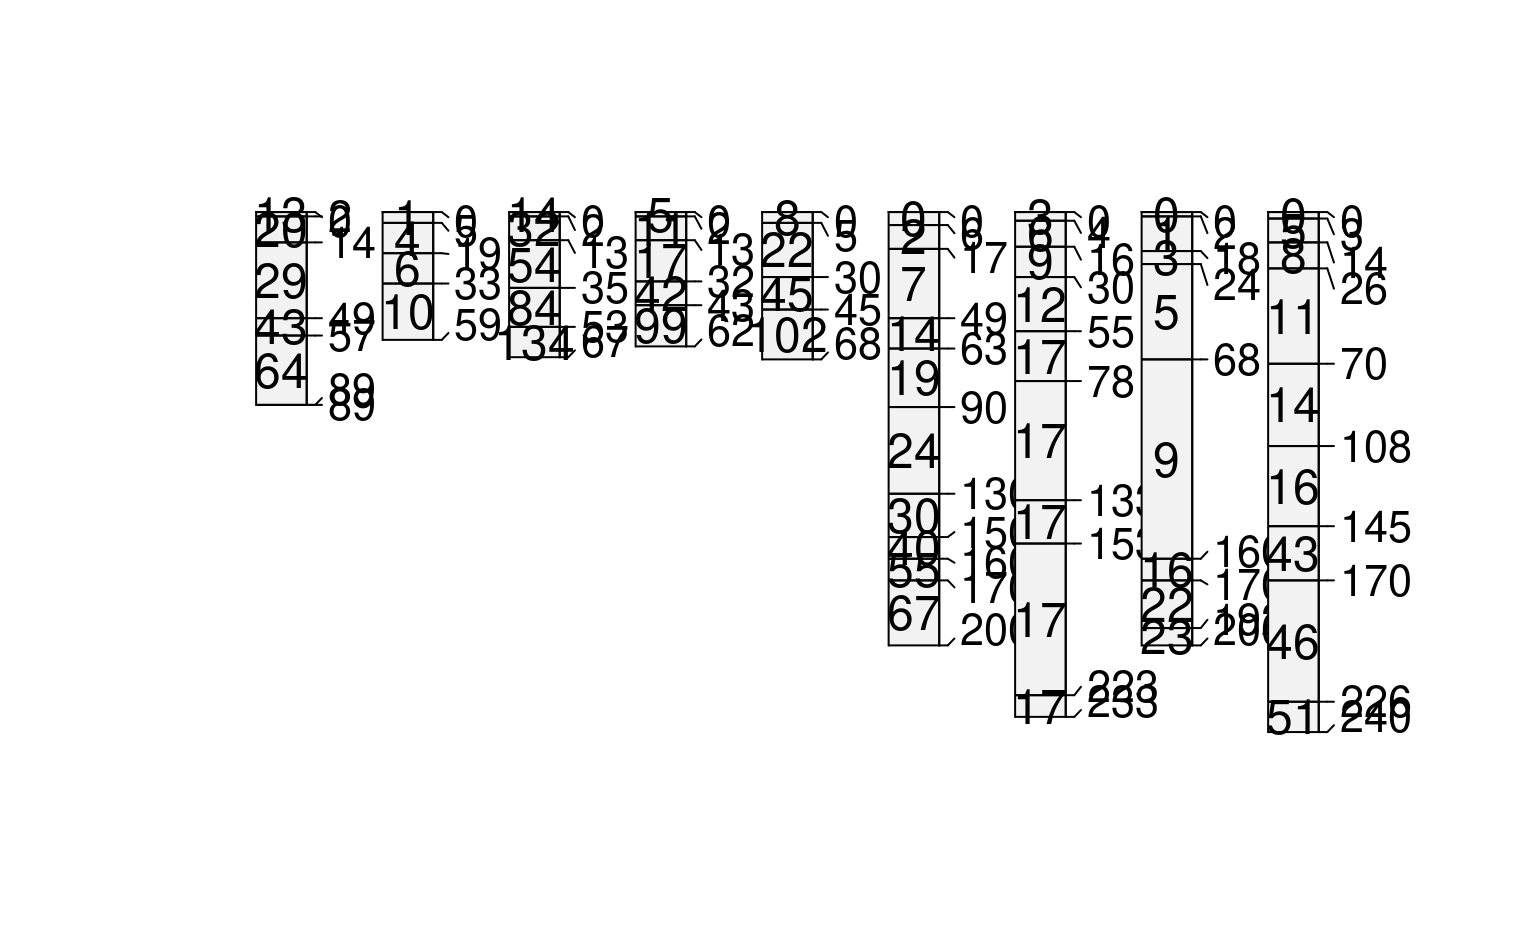
 # compute depth-wise cumulative sum by profile
# note the use of an anonymous function
sp1$d <- profileApply(sp1, FUN=function(x) cumsum(x$prop))
plot(sp1, name='d')
#> [P001:6] horizon with top == bottom, cannot fix horizon depth overlap
#> consider using repairMissingHzDepths()
# compute depth-wise cumulative sum by profile
# note the use of an anonymous function
sp1$d <- profileApply(sp1, FUN=function(x) cumsum(x$prop))
plot(sp1, name='d')
#> [P001:6] horizon with top == bottom, cannot fix horizon depth overlap
#> consider using repairMissingHzDepths()
 # compute profile-means, and save to @site
# there must be some data in @site for this to work
site(sp1) <- ~ group
sp1$mean_prop <- profileApply(sp1, FUN=function(x) mean(x$prop, na.rm=TRUE))
# re-plot using ranks defined by computed summaries (in @site)
plot(sp1, plot.order=rank(sp1$mean_prop))
#> [P001:6] horizon with top == bottom, cannot fix horizon depth overlap
#> consider using repairMissingHzDepths()
# compute profile-means, and save to @site
# there must be some data in @site for this to work
site(sp1) <- ~ group
sp1$mean_prop <- profileApply(sp1, FUN=function(x) mean(x$prop, na.rm=TRUE))
# re-plot using ranks defined by computed summaries (in @site)
plot(sp1, plot.order=rank(sp1$mean_prop))
#> [P001:6] horizon with top == bottom, cannot fix horizon depth overlap
#> consider using repairMissingHzDepths()
 ## iterate over profiles, calculate on each horizon, merge into original SPC
# example data
data(sp1)
# promote to SoilProfileCollection
depths(sp1) <- id ~ top + bottom
#> This is already a SoilProfileCollection-class object, doing nothing.
site(sp1) <- ~ group
#> Error in eval(predvars, data, env): object 'group' not found
# calculate horizon thickness and proportional thickness
# returns a data.frame result with multiple attributes per horizon
thicknessFunction <- function(p) {
hz <- horizons(p)
depthnames <- horizonDepths(p)
res <- data.frame(profile_id(p), hzID(p),
thk=(hz[[depthnames[[2]]]] - hz[[depthnames[1]]]))
res$hz_prop <- res$thk / sum(res$thk)
colnames(res) <- c(idname(p), hzidname(p), 'hz_thickness', 'hz_prop')
return(res)
}
# list output option with simplify=F, list names are profile_id(sp1)
list.output <- profileApply(sp1, thicknessFunction, simplify = FALSE)
head(list.output)
#> $P001
#> id hzID hz_thickness hz_prop
#> 1 P001 1 2 0.02247191
#> 2 P001 2 12 0.13483146
#> 3 P001 3 35 0.39325843
#> 4 P001 4 8 0.08988764
#> 5 P001 5 32 0.35955056
#> 6 P001 6 0 0.00000000
#>
#> $P002
#> id hzID hz_thickness hz_prop
#> 1 P002 7 5 0.08474576
#> 2 P002 8 14 0.23728814
#> 3 P002 9 14 0.23728814
#> 4 P002 10 26 0.44067797
#>
#> $P003
#> id hzID hz_thickness hz_prop
#> 1 P003 11 2 0.02985075
#> 2 P003 12 11 0.16417910
#> 3 P003 13 22 0.32835821
#> 4 P003 14 18 0.26865672
#> 5 P003 15 14 0.20895522
#>
#> $P004
#> id hzID hz_thickness hz_prop
#> 1 P004 16 2 0.03225806
#> 2 P004 17 11 0.17741935
#> 3 P004 18 19 0.30645161
#> 4 P004 19 11 0.17741935
#> 5 P004 20 19 0.30645161
#>
#> $P005
#> id hzID hz_thickness hz_prop
#> 1 P005 21 5 0.07352941
#> 2 P005 22 25 0.36764706
#> 3 P005 23 15 0.22058824
#> 4 P005 24 23 0.33823529
#>
#> $P006
#> id hzID hz_thickness hz_prop
#> 1 P006 25 6 0.030
#> 2 P006 26 11 0.055
#> 3 P006 27 32 0.160
#> 4 P006 28 14 0.070
#> 5 P006 29 27 0.135
#> 6 P006 30 40 0.200
#> 7 P006 31 20 0.100
#> 8 P006 32 10 0.050
#> 9 P006 33 10 0.050
#> 10 P006 34 30 0.150
#>
# data.frame output option with frameify=TRUE
df.output <- profileApply(sp1, thicknessFunction, frameify = TRUE)
head(df.output)
#> id hzID hz_thickness hz_prop
#> 1 P001 1 2 0.02247191
#> 2 P001 2 12 0.13483146
#> 3 P001 3 35 0.39325843
#> 4 P001 4 8 0.08988764
#> 5 P001 5 32 0.35955056
#> 6 P001 6 0 0.00000000
# since df.output contains idname(sp1) and hzidname(sp1),
# it can safely be merged by a left-join via horizons<- setter
horizons(sp1) <- df.output
plot(density(sp1$hz_thickness, na.rm=TRUE), main="Density plot of Horizon Thickness")
## iterate over profiles, calculate on each horizon, merge into original SPC
# example data
data(sp1)
# promote to SoilProfileCollection
depths(sp1) <- id ~ top + bottom
#> This is already a SoilProfileCollection-class object, doing nothing.
site(sp1) <- ~ group
#> Error in eval(predvars, data, env): object 'group' not found
# calculate horizon thickness and proportional thickness
# returns a data.frame result with multiple attributes per horizon
thicknessFunction <- function(p) {
hz <- horizons(p)
depthnames <- horizonDepths(p)
res <- data.frame(profile_id(p), hzID(p),
thk=(hz[[depthnames[[2]]]] - hz[[depthnames[1]]]))
res$hz_prop <- res$thk / sum(res$thk)
colnames(res) <- c(idname(p), hzidname(p), 'hz_thickness', 'hz_prop')
return(res)
}
# list output option with simplify=F, list names are profile_id(sp1)
list.output <- profileApply(sp1, thicknessFunction, simplify = FALSE)
head(list.output)
#> $P001
#> id hzID hz_thickness hz_prop
#> 1 P001 1 2 0.02247191
#> 2 P001 2 12 0.13483146
#> 3 P001 3 35 0.39325843
#> 4 P001 4 8 0.08988764
#> 5 P001 5 32 0.35955056
#> 6 P001 6 0 0.00000000
#>
#> $P002
#> id hzID hz_thickness hz_prop
#> 1 P002 7 5 0.08474576
#> 2 P002 8 14 0.23728814
#> 3 P002 9 14 0.23728814
#> 4 P002 10 26 0.44067797
#>
#> $P003
#> id hzID hz_thickness hz_prop
#> 1 P003 11 2 0.02985075
#> 2 P003 12 11 0.16417910
#> 3 P003 13 22 0.32835821
#> 4 P003 14 18 0.26865672
#> 5 P003 15 14 0.20895522
#>
#> $P004
#> id hzID hz_thickness hz_prop
#> 1 P004 16 2 0.03225806
#> 2 P004 17 11 0.17741935
#> 3 P004 18 19 0.30645161
#> 4 P004 19 11 0.17741935
#> 5 P004 20 19 0.30645161
#>
#> $P005
#> id hzID hz_thickness hz_prop
#> 1 P005 21 5 0.07352941
#> 2 P005 22 25 0.36764706
#> 3 P005 23 15 0.22058824
#> 4 P005 24 23 0.33823529
#>
#> $P006
#> id hzID hz_thickness hz_prop
#> 1 P006 25 6 0.030
#> 2 P006 26 11 0.055
#> 3 P006 27 32 0.160
#> 4 P006 28 14 0.070
#> 5 P006 29 27 0.135
#> 6 P006 30 40 0.200
#> 7 P006 31 20 0.100
#> 8 P006 32 10 0.050
#> 9 P006 33 10 0.050
#> 10 P006 34 30 0.150
#>
# data.frame output option with frameify=TRUE
df.output <- profileApply(sp1, thicknessFunction, frameify = TRUE)
head(df.output)
#> id hzID hz_thickness hz_prop
#> 1 P001 1 2 0.02247191
#> 2 P001 2 12 0.13483146
#> 3 P001 3 35 0.39325843
#> 4 P001 4 8 0.08988764
#> 5 P001 5 32 0.35955056
#> 6 P001 6 0 0.00000000
# since df.output contains idname(sp1) and hzidname(sp1),
# it can safely be merged by a left-join via horizons<- setter
horizons(sp1) <- df.output
plot(density(sp1$hz_thickness, na.rm=TRUE), main="Density plot of Horizon Thickness")
 ## iterate over profiles, subsetting horizon data
# example data
data(sp1)
# promote to SoilProfileCollection
depths(sp1) <- id ~ top + bottom
#> This is already a SoilProfileCollection-class object, doing nothing.
site(sp1) <- ~ group
#> Error in eval(predvars, data, env): object 'group' not found
# make some fake site data related to a depth of some importance
sp1$dep <- profileApply(sp1, function(i) {round(rnorm(n=1, mean=mean(i$top)))})
# custom function for subsetting horizon data, by profile
# keep horizons with lower boundary < site-level attribute 'dep'
fun <- function(i) {
# extract horizons
h <- horizons(i)
# make an expression to subset horizons
exp <- paste('bottom < ', i$dep, sep='')
# subset horizons, and write-back into current SPC
slot(i, 'horizons') <- subset(h, subset=eval(parse(text=exp)))
# return modified SPC
return(i)
}
# list of modified SoilProfileCollection objects
l <- profileApply(sp1, fun, simplify=FALSE)
# re-combine list of SoilProfileCollection objects into a single SoilProfileCollection
sp1.sub <- pbindlist(l)
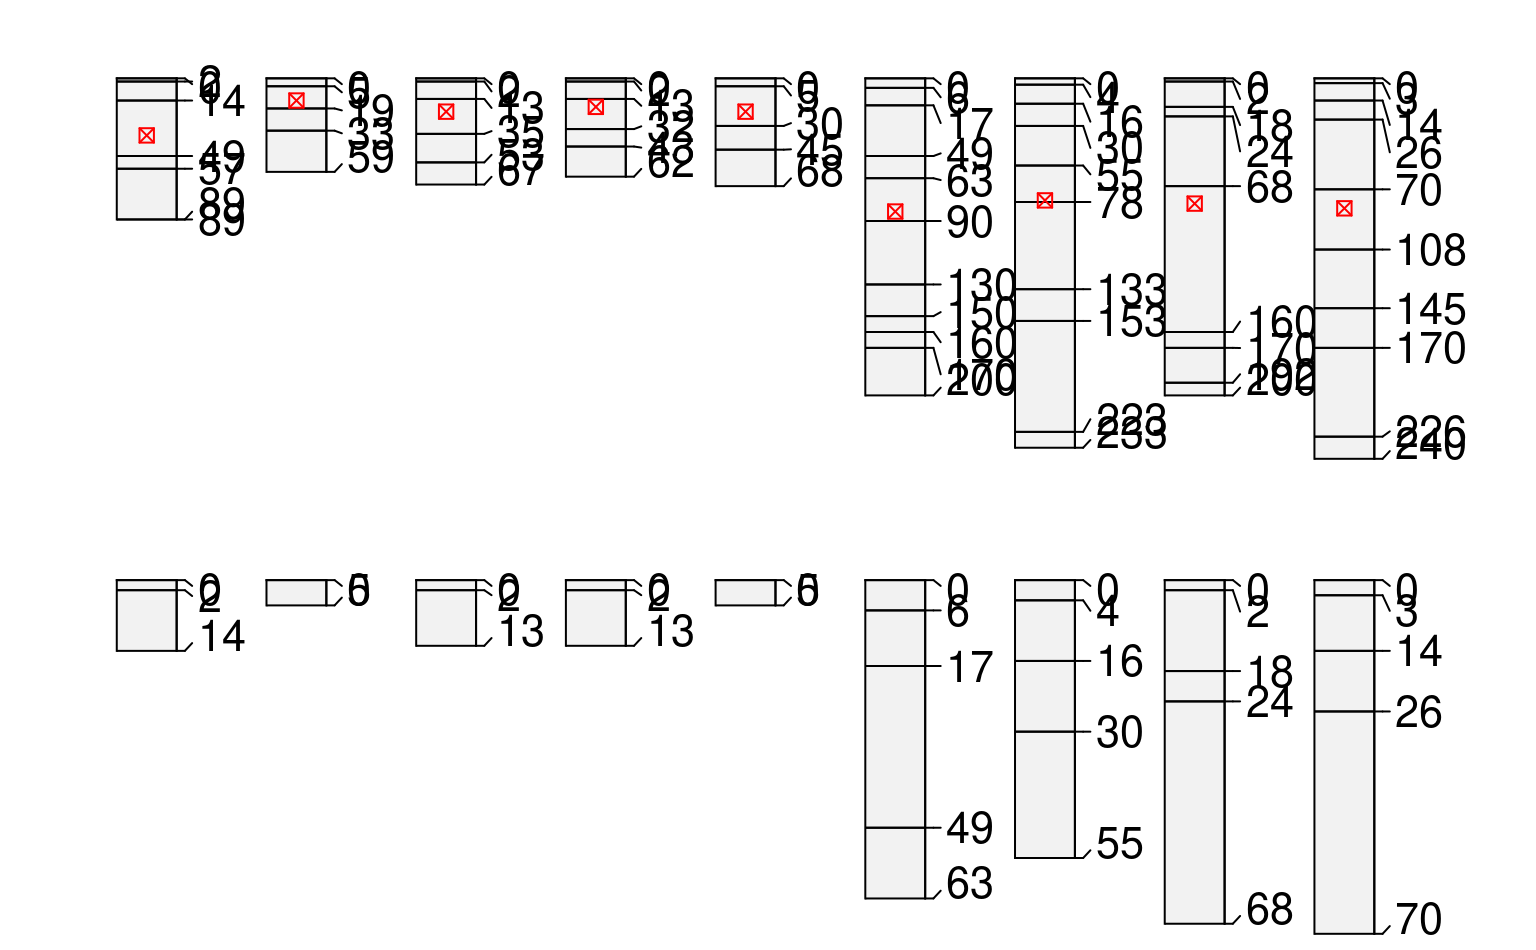
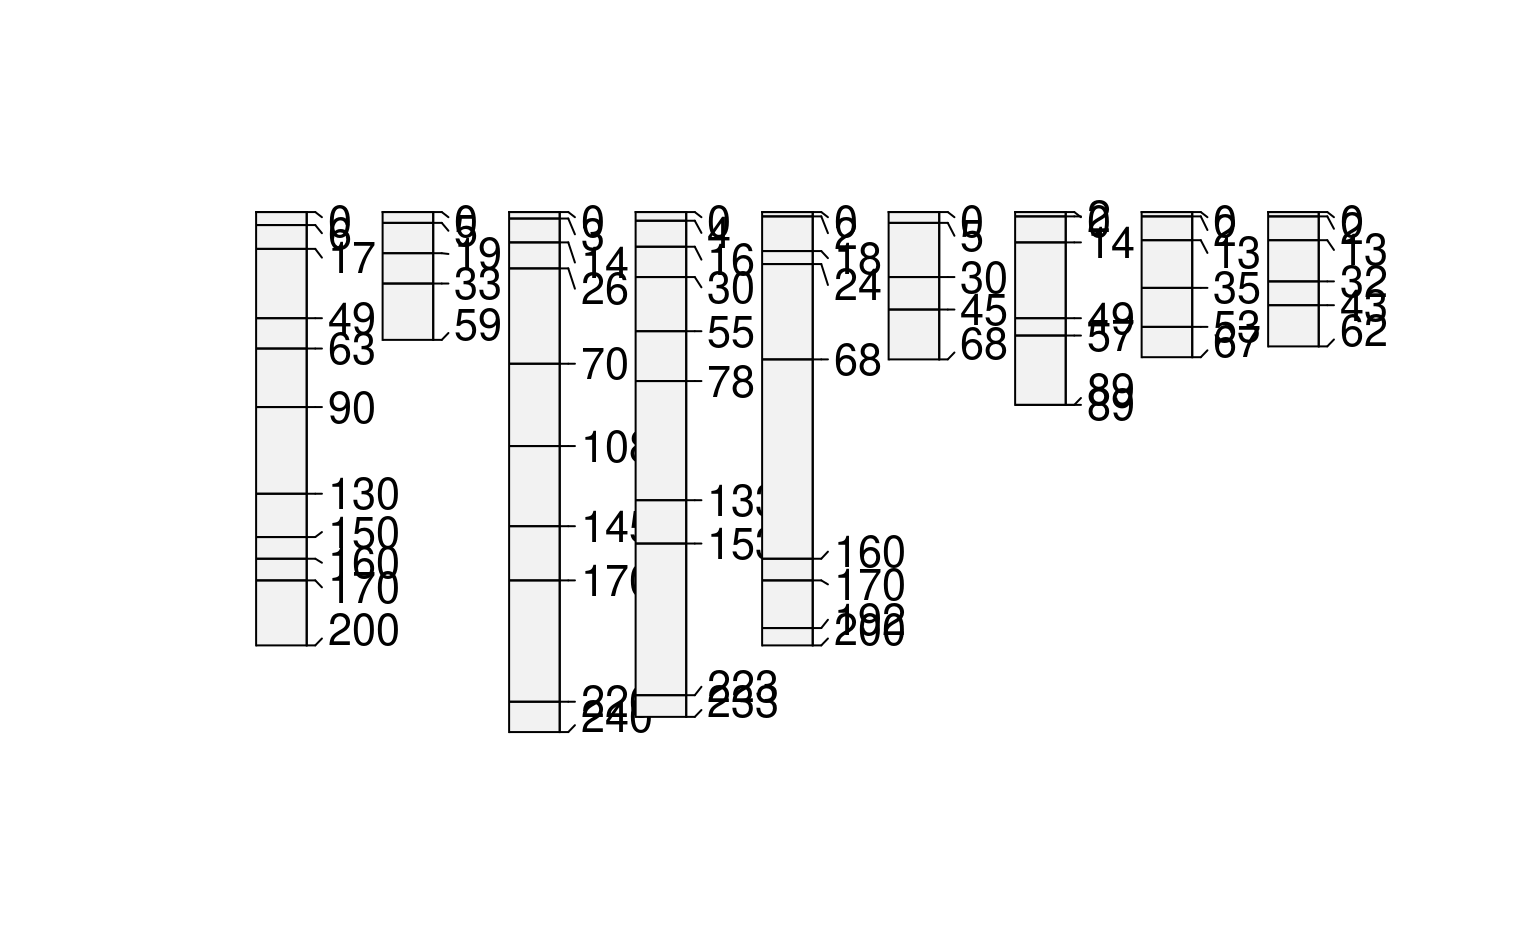
# graphically check
par(mfrow=c(2,1), mar=c(0,0,1,0))
plot(sp1)
#> [P001:6] horizon with top == bottom, cannot fix horizon depth overlap
#> consider using repairMissingHzDepths()
points(1:length(sp1), sp1$dep, col='red', pch=7)
plot(sp1.sub)
## iterate over profiles, subsetting horizon data
# example data
data(sp1)
# promote to SoilProfileCollection
depths(sp1) <- id ~ top + bottom
#> This is already a SoilProfileCollection-class object, doing nothing.
site(sp1) <- ~ group
#> Error in eval(predvars, data, env): object 'group' not found
# make some fake site data related to a depth of some importance
sp1$dep <- profileApply(sp1, function(i) {round(rnorm(n=1, mean=mean(i$top)))})
# custom function for subsetting horizon data, by profile
# keep horizons with lower boundary < site-level attribute 'dep'
fun <- function(i) {
# extract horizons
h <- horizons(i)
# make an expression to subset horizons
exp <- paste('bottom < ', i$dep, sep='')
# subset horizons, and write-back into current SPC
slot(i, 'horizons') <- subset(h, subset=eval(parse(text=exp)))
# return modified SPC
return(i)
}
# list of modified SoilProfileCollection objects
l <- profileApply(sp1, fun, simplify=FALSE)
# re-combine list of SoilProfileCollection objects into a single SoilProfileCollection
sp1.sub <- pbindlist(l)
# graphically check
par(mfrow=c(2,1), mar=c(0,0,1,0))
plot(sp1)
#> [P001:6] horizon with top == bottom, cannot fix horizon depth overlap
#> consider using repairMissingHzDepths()
points(1:length(sp1), sp1$dep, col='red', pch=7)
plot(sp1.sub)