Fix Overlap within a Sequence via Simulated Annealing
Source:R/aqp-label-placement-solvers.R
SANN_1D.RdThis function makes small adjustments to elements of x until overlap defined by thresh is removed, or until maxIter is reached. Rank order and boundary conditions (defined by min.x and max.x) are preserved. The underlying algorithm is based on simulated annealing. The "cooling schedule" parameters T0 and k can be used to tune the algorithm for specific applications.
Arguments
- x
vector of horizontal positions, pre-sorted
- thresh
horizontal threshold defining "overlap" or distance between elements of
x. For adjusting soil profile sketches values are typically < 1 and likely in (0.3, 0.8).- adj
specifies the size of perturbations within
runif(min = adj * -1, max = adj). Larger values will sometimes reduce the number of iterations required to solve particularly difficult overlap conditions. SeecoolingRateargument whenadjis large- min.x
left-side boundary condition, consider expanding if a solution cannot be found within
maxIter.- max.x
right-side boundary condition, consider expanding if a solution cannot be found within
maxIter.- maxIter
maximum number of iterations to attempt before giving up and returning a regularly-spaced sequence
- trace
print diagnostics, result is a
listvsvector- tiny
the smallest allowable overlap
- T0
starting temperature
- k
cooling constant
- ...
not used, absorbs additional arguments to
fixOverlap()
Value
When trace = FALSE, a vector of the same length as x, preserving rank-ordering and boundary conditions. When trace = TRUE a list containing the new sequence along with information about objective functions and decisions made during iteration.
Details
Ideas for solving difficult overlap scenarios:
widen the boundary conditions by adjusting
min.xandmax.xbeyond the original scale ofxreduce the allowable overlap threshold
threshreduce the magnitude of perturbations (
adj) and increasemaxIterincrease
k
Examples
x <- c(1, 2, 3, 3.4, 3.5, 5, 6, 10)
# easy
z <- fixOverlap(x, thresh = 0.2, trace = TRUE)
#> 2 iterations
# harder
z <- fixOverlap(x, thresh = 0.6, trace = TRUE)
#> 20 iterations
# much harder
z <- fixOverlap(x, thresh = 0.9, trace = TRUE)
#> 88 iterations
# interpret `trace` output
# relatively challenging
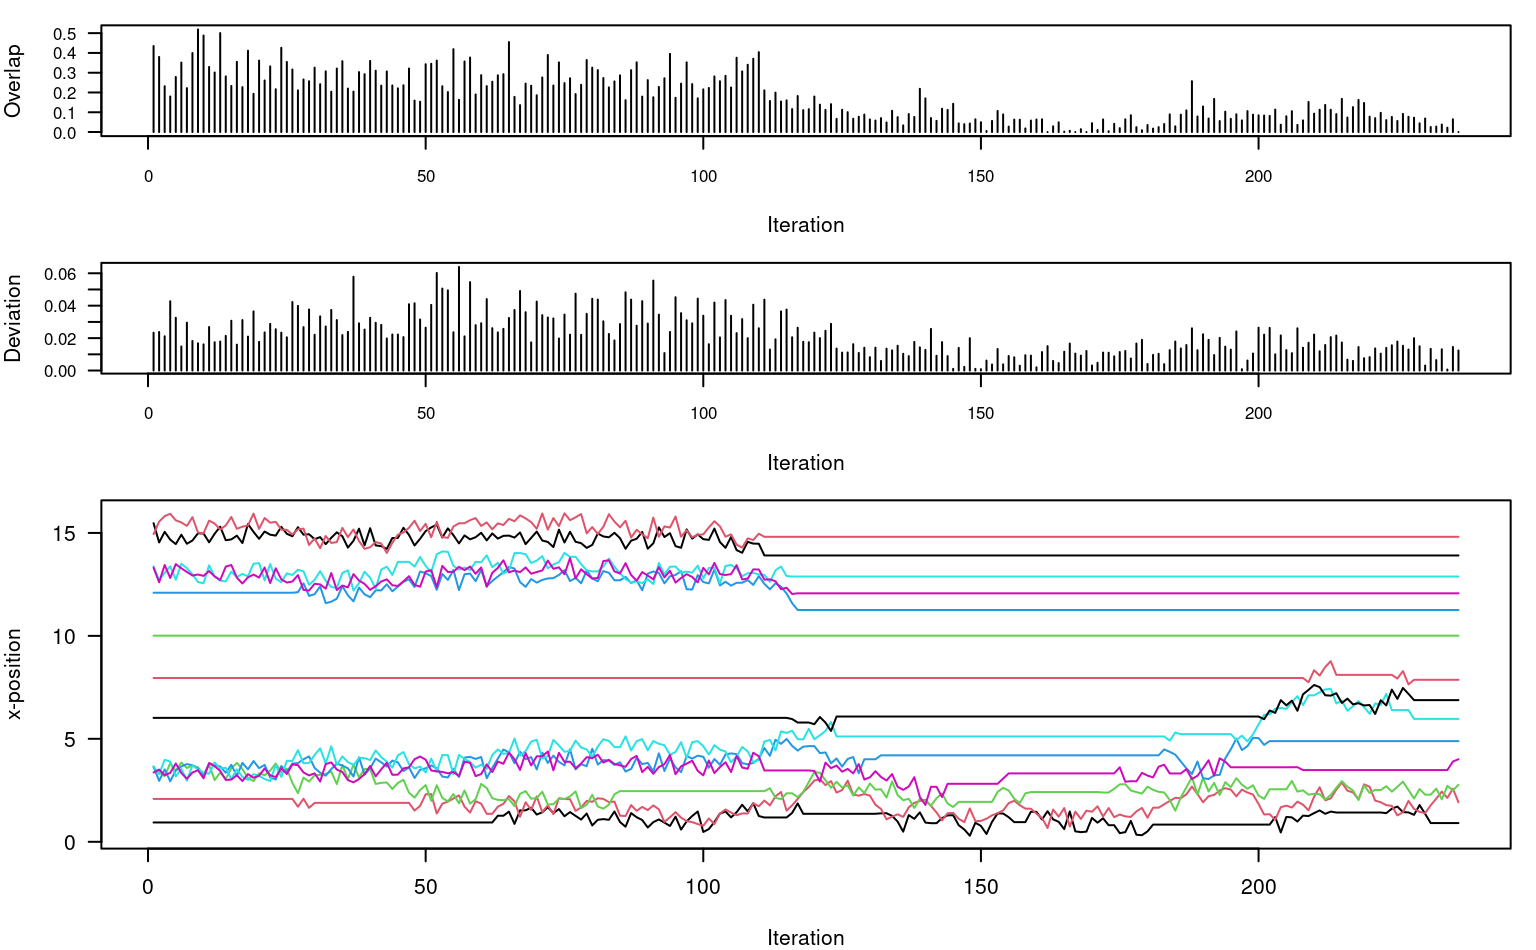
x <- c(1, 2, 3.4, 3.4, 3.4, 3.4, 6, 8, 10, 12, 13, 13, 15, 15.5)
# fix overlap, return debugging information
set.seed(10101)
z <- fixOverlap(x, thresh = 0.8, trace = TRUE)
#> duplicates in `x`, applying jitter
#> 237 iterations
# setup plot device
par(mar = c(4, 4, 1, 1))
layout(matrix(c(1,2,3)), widths = 1, heights = c(1,1,2))
# objective function = overlap + SSD
plot(
seq_along(z$stats), z$stats,
type = 'h', las = 1,
xlab = 'Iteration', ylab = 'Overlap',
cex.axis = 0.8
)
# SSD: deviation from original configuration
plot(
seq_along(z$ssd), z$ssd,
type = 'h', las = 1,
xlab = 'Iteration', ylab = 'Deviation',
cex.axis = 0.8
)
# adjustments at each iteration
matplot(
z$states, type = 'l',
lty = 1, las = 1,
xlab = 'Iteration', ylab = 'x-position'
)
 # trace log
# B: boundary condition violation
# O: rank (order) violation
# +: accepted perturbation
# -: rejected perturbation
table(z$log)
#>
#> B O + -
#> 41 114 78 3
# trace log
# B: boundary condition violation
# O: rank (order) violation
# +: accepted perturbation
# -: rejected perturbation
table(z$log)
#>
#> B O + -
#> 41 114 78 3