Iteratively Attempt Hydrologic Ordering of Geomorphic Proportion Matrix
Source:R/iterateHydOrder.R
iterateHydOrder.RdIteratively Attempt Hydrologic Ordering of Geomorphic Proportion Matrix
iterateHydOrder(
  x,
  g,
  target = 0.9,
  maxIter = 20,
  j.amount = 0.001,
  verbose = FALSE,
  trace = FALSE
)
Arguments
- x
data.framegeomorphic proportion matrix, as created bysoilDB::fetchOSD(..., extended=TRUE)- g
name of geomorphic summary table, one of:
c('geomcomp', 'hillpos', 'flats', 'terrace', 'mtnpos', 'shape', 'geomorphons')- target
numeric, target match rate
- maxIter
integer, maximum number of perturbations of geomorphic probability matrix
- j.amount
numeric, amount of noise applied to rows with too few unique values, passed to
hydOrder()- verbose
logical, additional output printed via message
- trace
logical, additional list of results for each iteration
Value
A list with the following elements:
clust: rotatedhclustobjecthyd.order: vector of series names, in hydrologic orderingclust.hyd.order: vector of series names, after clustering + rotation, approximate hydrologic orderingmatch.rate: fraction of series matching target hydrologic ordering, after clustering + rotationobj: objective function value (sum of squared rank differences), used byiterateHydOrder()niter: number of iterationstrace: list of results by iteration, only whentrace = TRUE
Details
This function is used by the suite of geomorphic proportion visualization functions (viz*) to attempt rotation of a dendrogram according to "hydrologic ordering" rules. A perfect rotation is not always possible, and reported as a match rate in the returned score value
Examples
# example data, similar to results from soilDB::fetchOSD(..., extended = TRUE)
data("OSDexamples")
# single iteration of hydrologic ordering
h1 <- hydOrder(OSDexamples$hillpos, g = 'hillpos', clust = TRUE)
# perform several iterations, keep the best one
h2 <- iterateHydOrder(OSDexamples$hillpos, 'hillpos', verbose = TRUE)
#> 35.3% match rate after 20 iterations
# compare: only slightly better match rate achieved
h1$match.rate
#> [1] 0.3529412
h2$match.rate
#> [1] 0.3529412
# return trace log for eval of objective function
# increase max iterations
h2 <- iterateHydOrder(OSDexamples$hillpos, 'hillpos', maxIter = 100, verbose = TRUE, trace = TRUE)
#> 35.3% match rate after 100 iterations
# inspect objective function evolution
tr <- h2$trace
obj <- sapply(tr, '[[', 'obj')
plot(obj, type = 'b')
 hist(obj)
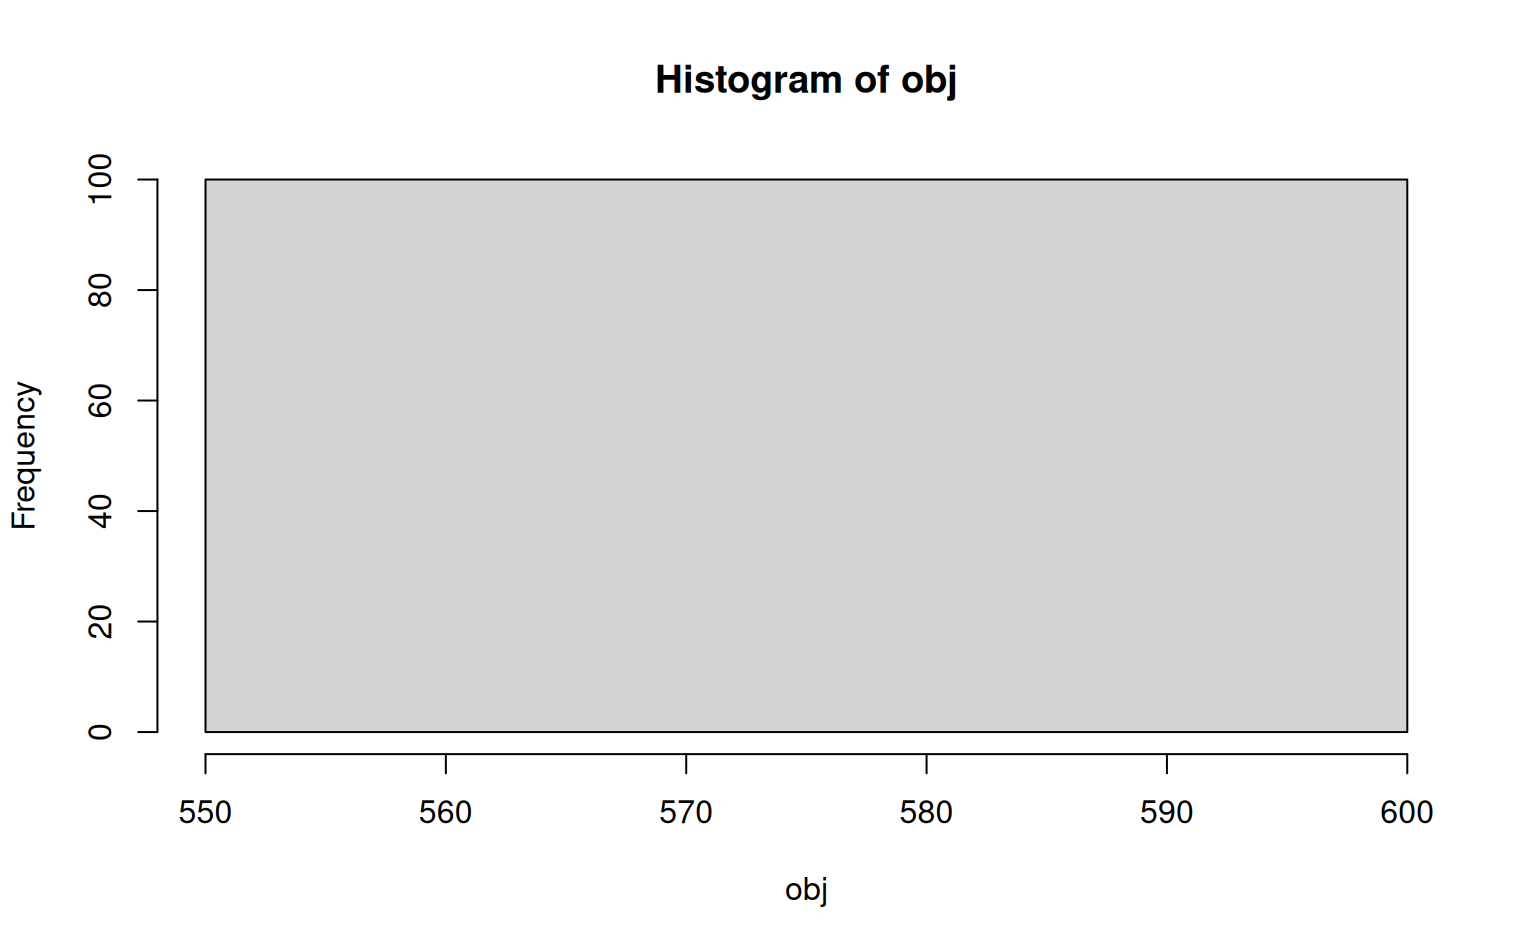 # in this case the clustering of hillpos proportions has only two possible configurations