Soil Texture Low-RV-High as Defined by Quantiles
Source:R/textureTriangleSummary.R
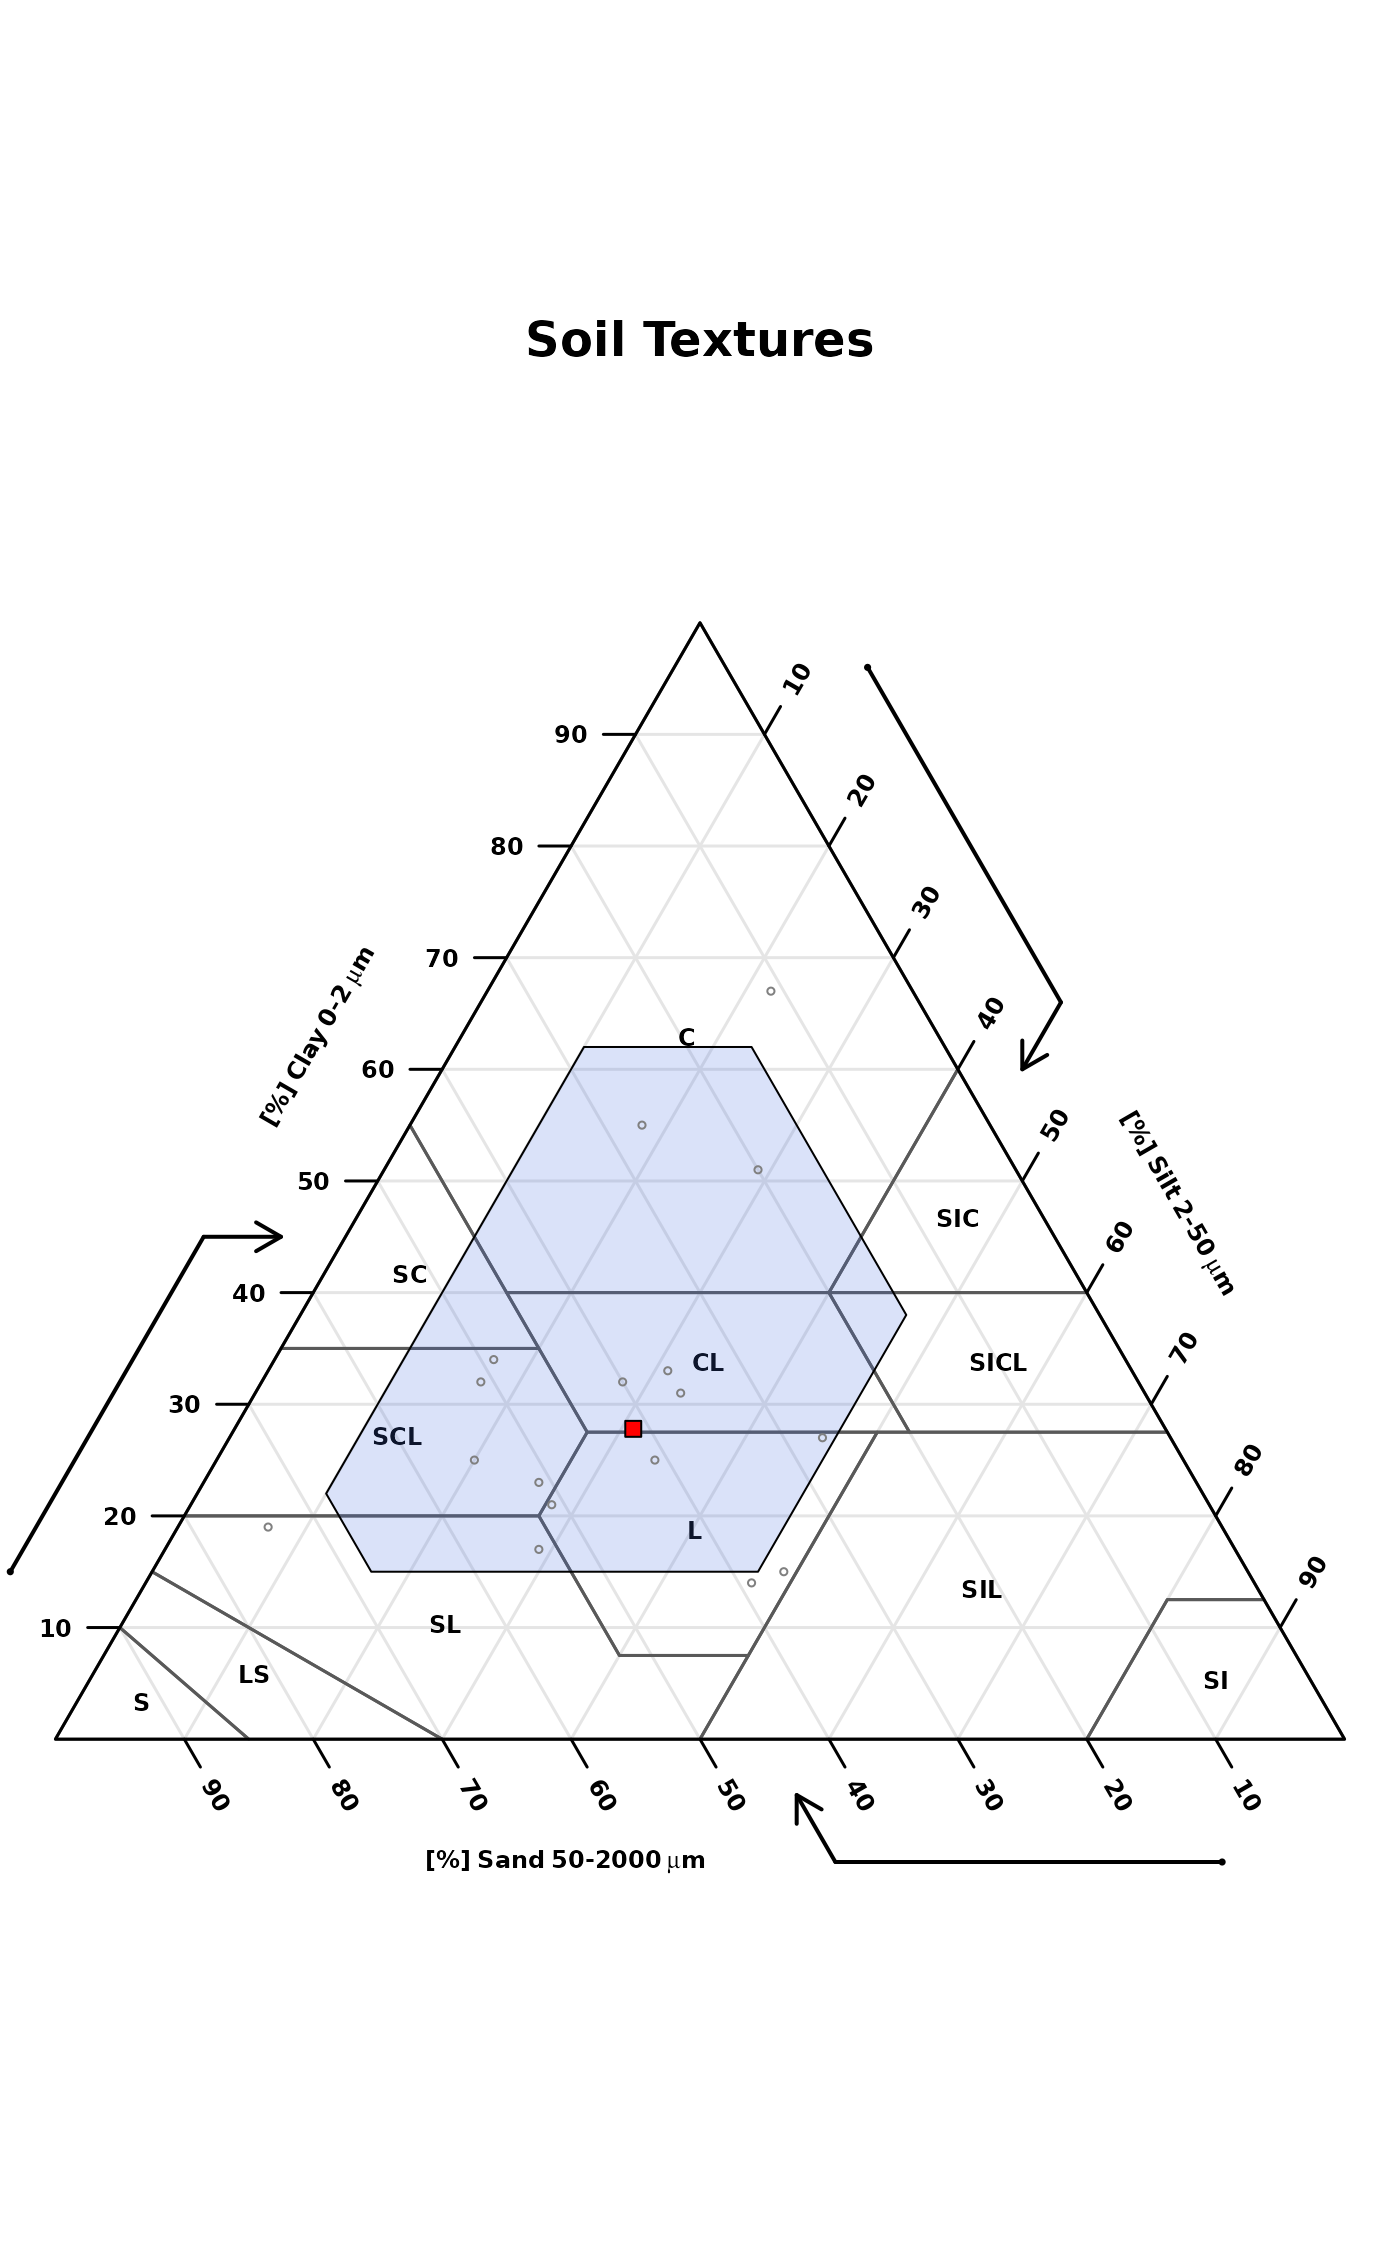
textureTriangleSummary.RdThis function accepts soil texture components (sand, silt, and clay percentages) and plots a soil texture triangle with a "representative value" (point) and low-high region (polygon) defined by quantiles (estimated with Hmisc::hdquantile). Marginal quantiles of sand, silt, and clay are used to define the boundary of a low-high region. The default settings place the RV symbol at the texture defined by marginal medians of sand, silt, and clay. The default low-high region is defined by the 5th and 95th marginal percentiles of sand, silt, and clay.
Usage
textureTriangleSummary(
  ssc,
  p = c(0.05, 0.5, 0.95),
  delta = 1,
  rv.col = "red",
  range.border = "black",
  range.col = "RoyalBlue",
  range.alpha = 80,
  range.lty = 1,
  range.lwd = 2,
  main = "Soil Textures",
  legend.cex = 0.75,
  legend = TRUE,
  ...
)
Arguments
- ssc
data.framewith columns: 'SAND', 'SILT', 'CLAY', values are percentages that should add to 100. No NA allowed.- p
vector of percentiles (length = 3) defining 'low', 'representative value', and 'high'
- delta
grid size used to form low-high region
- rv.col
color used for representative value (RV) symbol
- range.border
color used for polygon border enclosing the low-high region
- range.col
color used for polygon enclosing the low-high region
- range.alpha
transparency of the low-high range polygon (0-255)
- range.lty
line style for polygon enclosing the low-high region
- range.lwd
line weight polygon enclosing the low-high region
- main
plot title
- legend.cex
scaling factor for legend
- legend
logical, enable/disable automatic legend
- ...
further arguments passed to
soiltexture::TT.points
Examples
# \donttest{
if(
requireNamespace("Hmisc") &
requireNamespace("compositions") &
requireNamespace("soiltexture")
) {
# sample data
data('sp4')
# subset rows / columns
ssc <- sp4[grep('^Bt', sp4$name), c('sand', 'silt', 'clay')]
names(ssc) <- toupper(names(ssc))
# make figure, marginal percentiles are silently returned
stats <- textureTriangleSummary(
ssc, pch = 1, cex = 0.5,
range.alpha = 50,
range.lwd = 1,
col = grey(0.5),
legend = FALSE
)
# check
stats
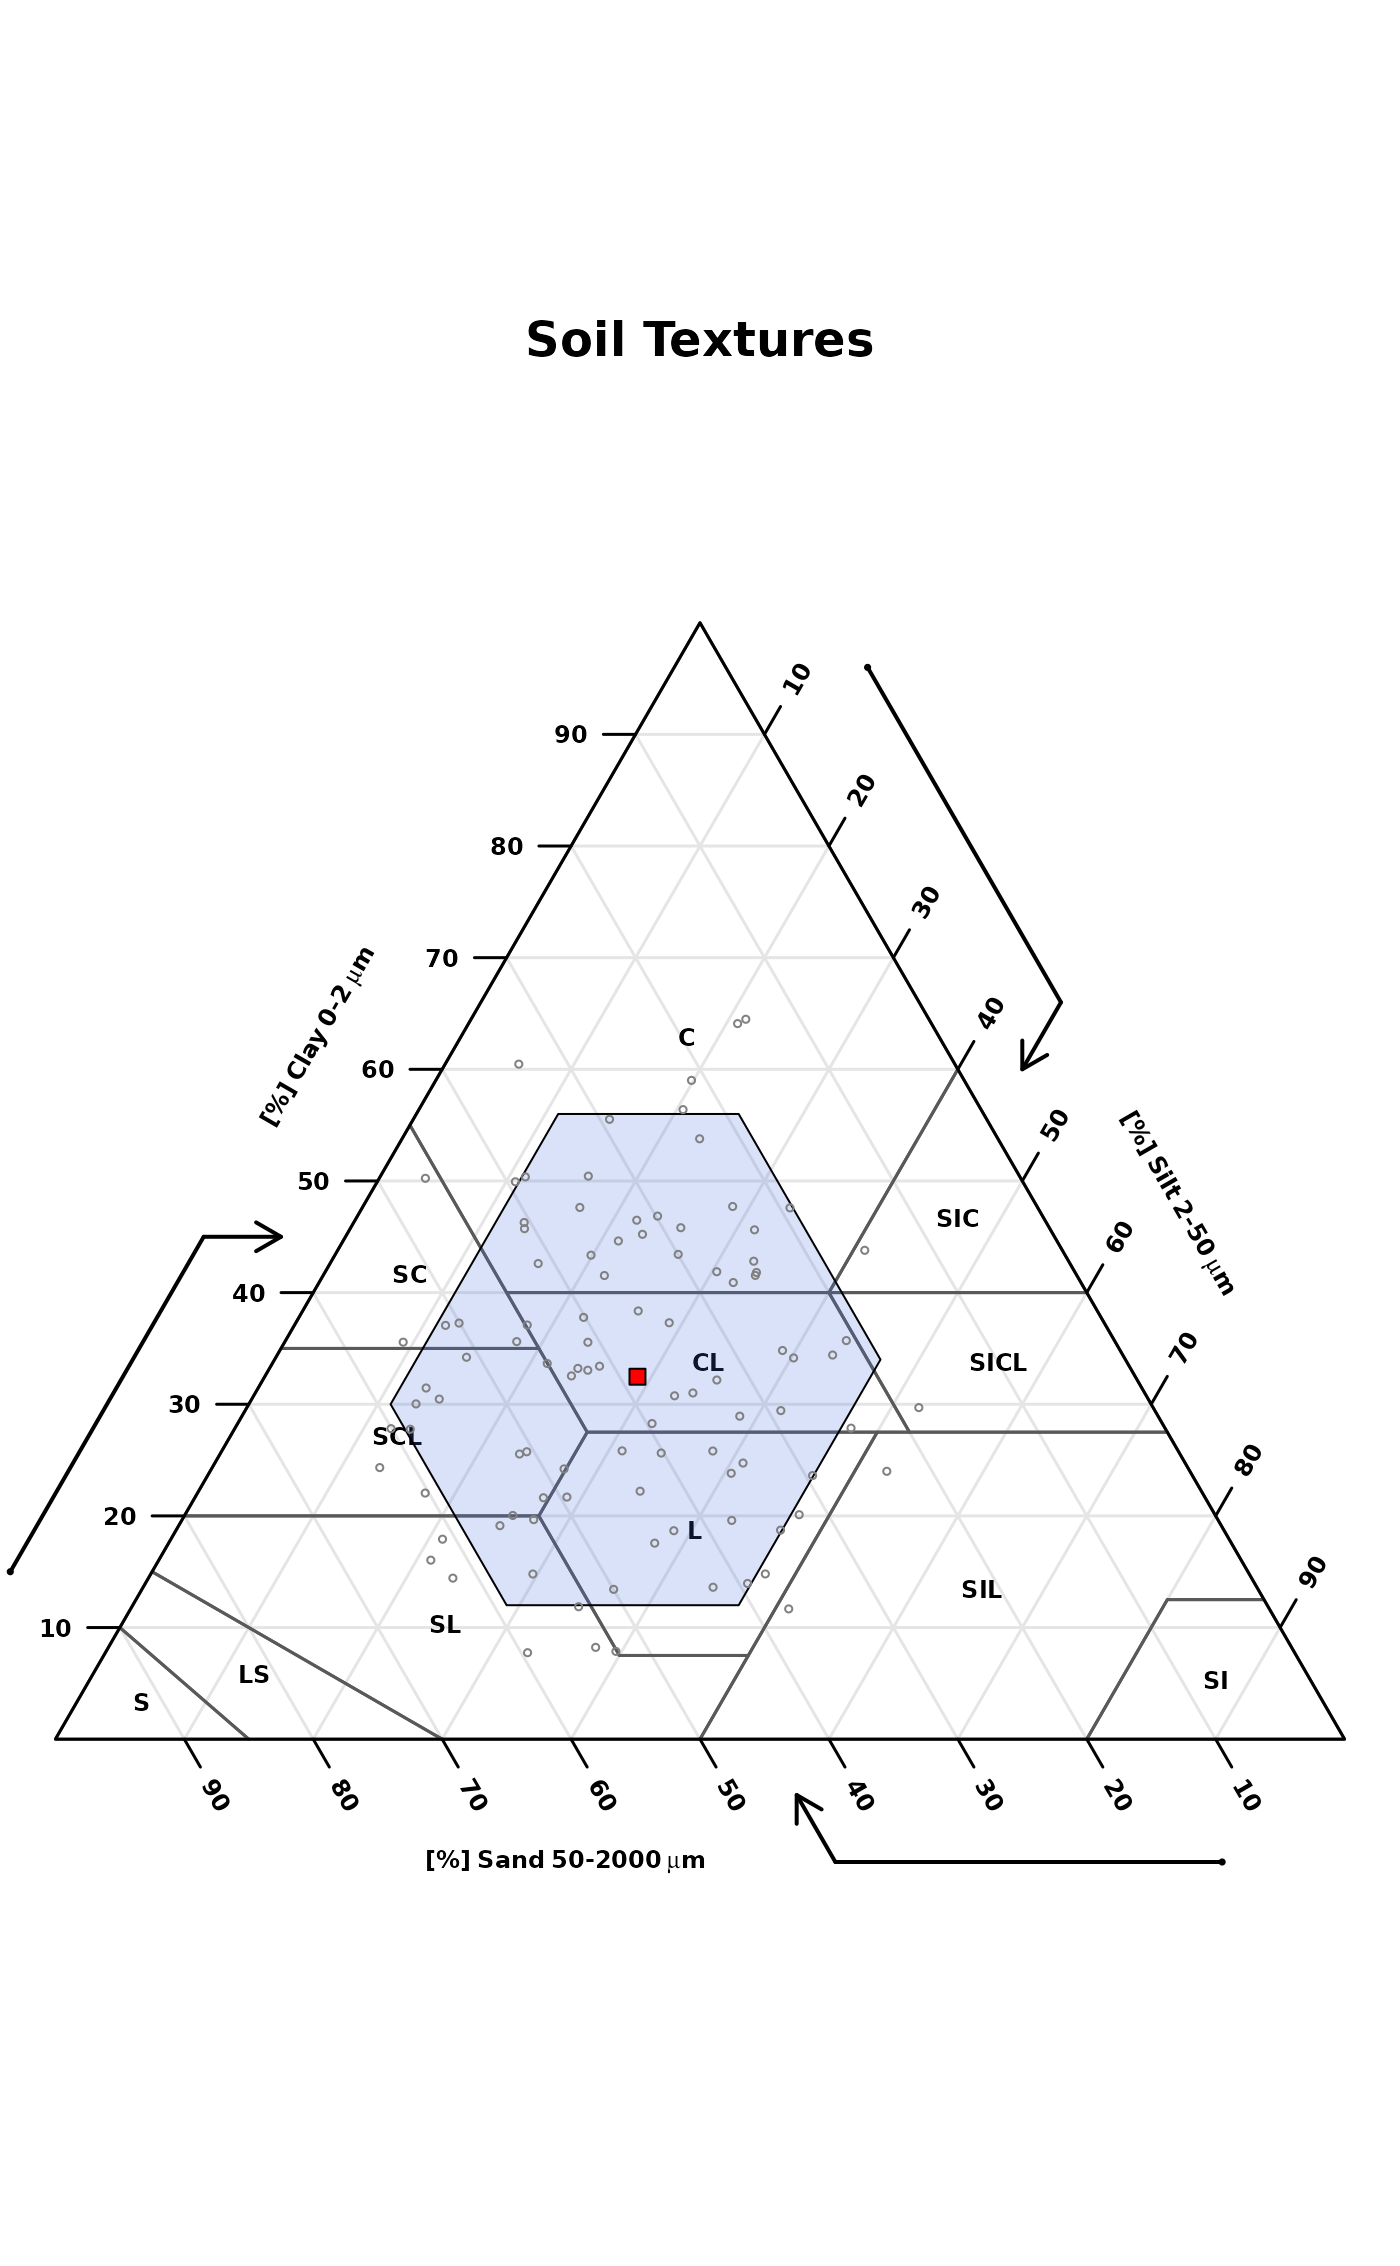
# simulate some data and try again
s <- bootstrapSoilTexture(ssc, n = 100)$samples
# make the figure, ignore results
textureTriangleSummary(
s, pch = 1, cex = 0.5,
range.alpha = 50,
range.lwd = 1,
col = grey(0.5),
legend = FALSE
)
}
 # }
# }