This function is used to support relative positioning of soil profiles by plotSPC, based on transect or gradient values typically associated with a site level attribute (e.g. elevation). Gradient values specified in x are translated to the range used by plotSPC (usually 1, length(SPC)) specified in x.min and x.max.
Arguments
- x
numeric vector, describing values along a transect: distance, elevation, climatic variables, etc.. Typically sourced from the site level attributes of a
SoilProfileCollectionobject. Order is not important.- x.min
numeric, lower boundary to relative position scale
- x.max
numeric, upper boundary to relative position scale
- fix
logical, attempt fixing overlapping positions with
fixOverlap- ...
additional arguments to
fixOverlap
Value
list containing:
grad: values ofxin ascending orderorder: ordering vector ofxrelative.pos: elements ofxtranslated to the new relative scale defined byx.minandx.max
Details
See the Pair-Wise Distances by Generalized Horizon Labels tutorial for additional examples.
Examples
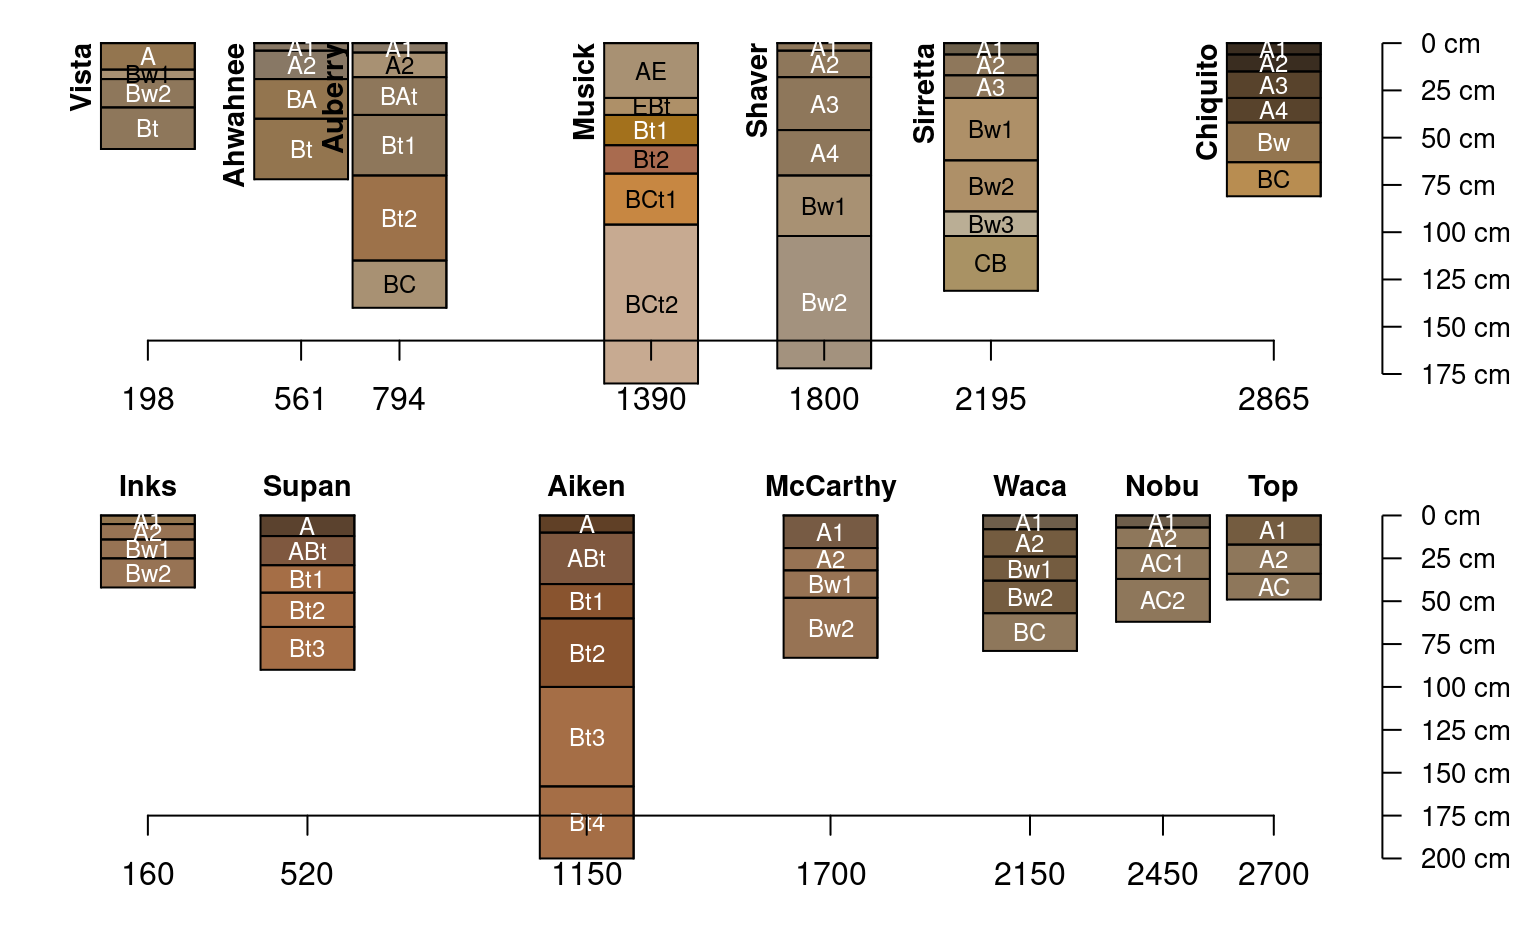
data("sierraTransect")

# split transects
g <- subset(sierraTransect, transect == 'Granite')
a <- subset(sierraTransect, transect == 'Andesite')

g.p <- alignTransect(g$elev, x.min = 1, x.max = length(g), fix = FALSE)
a.p <- alignTransect(a$elev, x.min = 1, x.max = length(a), fix = FALSE)

op <- par(mar=c(2,0,0,2), mfrow=c(2,1))

plotSPC(g, width=0.25, name.style='center-center',
        cex.names=0.75,
        relative.pos = g.p$relative.pos, plot.order = g.p$order)

axis(1, at = g.p$relative.pos, labels = g.p$grad, line = -1.5)

plotSPC(a, width=0.25, name.style='center-center',
        cex.names=0.75,
        relative.pos = a.p$relative.pos, plot.order = a.p$order)

axis(1, at = a.p$relative.pos, labels = a.p$grad, line = -1.5)


par(op)