A very simple function for generating labeled swatches of soil colors. Largely based on colorspace::swatchplot.
Usage
soilPalette(
  colors,
  lab = colors,
  lab.cex = 0.75,
  dynamic.labels = TRUE,
  x.inset = 0.01,
  y.inset = 0.01,
  ...
)
Arguments
- colors
vector of hex colors (e.g. #A66E46FF)
- lab
vector of labels
- lab.cex
character scaling for labels
- dynamic.labels
logical, adjust label colors for maximum contrast via
invertLabelColor- x.inset
horizontal adjustment for labels
- y.inset
vertical adjustment for labels
- ...
further arguments to
colorspace::swatchplot
Examples
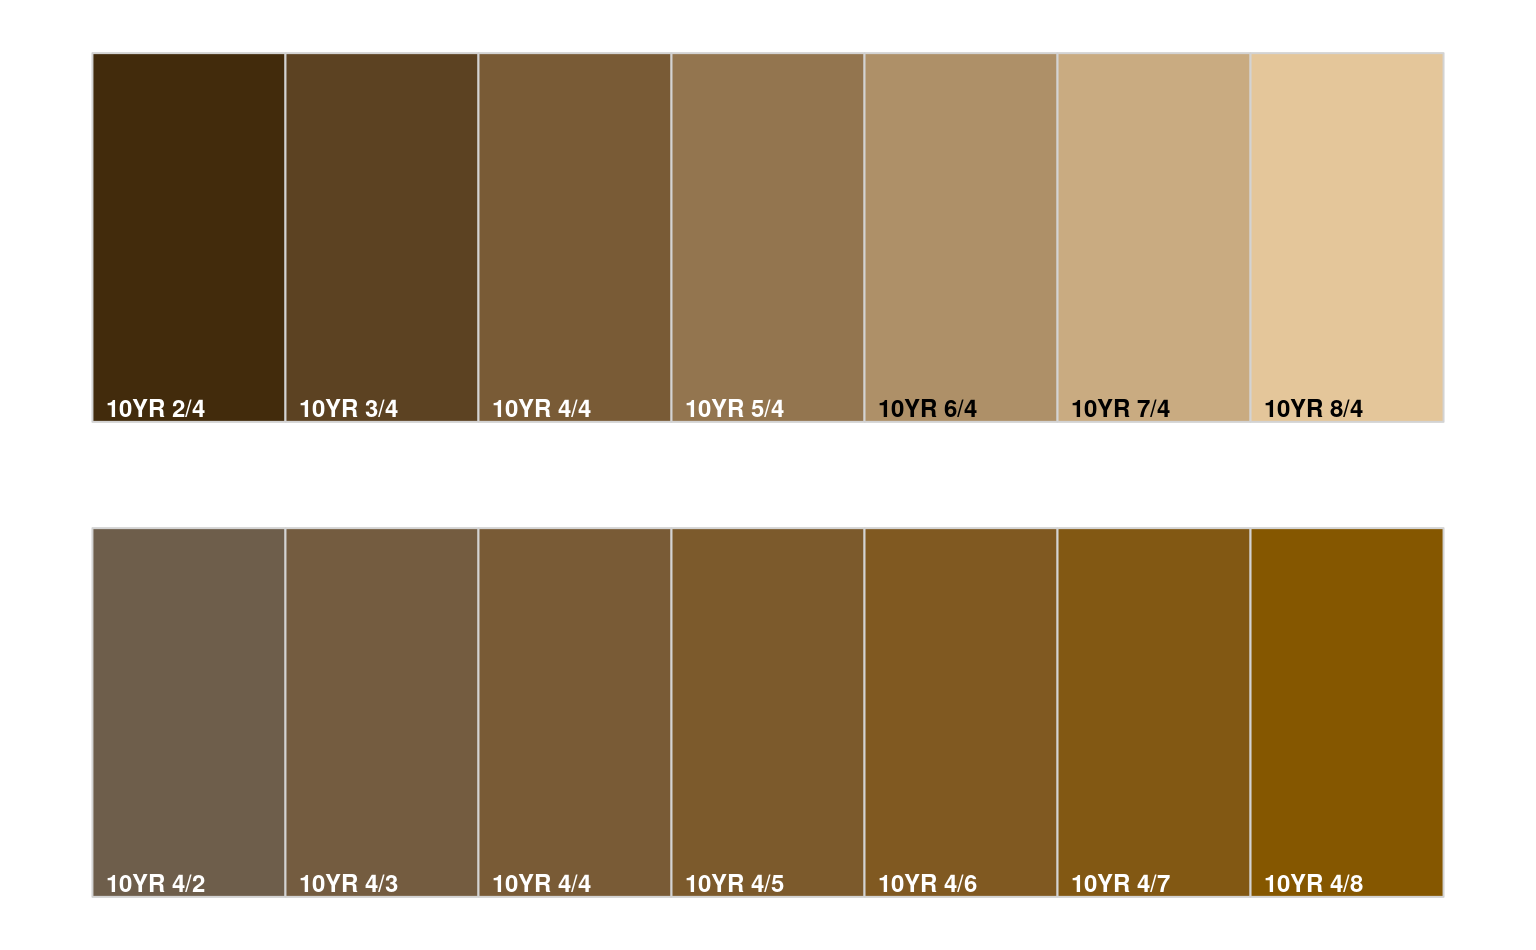
# maybe useful for teaching about soil color

par(mfrow=c(2,1), mar=c(1,1,1,1))

# demonstrate range of Munsell value
m <- sprintf('10YR %s/4', 2:8)
# convert to hex representation
cols <- parseMunsell(m)
# plot
soilPalette(cols, m)

# demonstrate range of Munsell chroma
m <- sprintf('10YR 4/%s', 2:8)
# convert to hex representation
cols <- parseMunsell(m)
# plot
soilPalette(cols, m)