This function computes several measures of "color variation", typically associated with soil colors described in the Munsell system, using the CIE2000 dE (dE00) color contrast metric. The resulting dE00 summaries map closely to color differences as perceived by "average human vision".
Usage
colorVariation(
  m,
  method = c("frequency", "centroid", "L1", "reference"),
  ref = NULL
)Value
numeric, dE00 summary of color variation along with group centroid for method = c('frequency', 'centroid', 'L1')
Details
dE00 values are computed according to method:
'frequency': relative to most frequent color in
m'centroid': relative to centroid (CIELAB coordinates) of colors specified in
m'L1': relative to L1-median (geometric median) CIELAB coordinates of colors specified in
m, viaGmedian::Gmedian()'reference': relative to color specified in
ref
The L1 method is more robust to outliers in m as compared to other methods.
Examples
# some brownish colors with a wild outlier
m <- c('10YR 3/3', '10YR 4/4', '10YR 4/4', '5GY 6/8')
# useful when there may be a lot of duplicates
# error when there is not a single, most-frequent color
colorVariation(m, method = 'frequency')
#> [1] 10.06968
#> attr(,"most frequent")
#> [1] "10YR 4/4"
# statistical "centroid" of colors, not robust to outliers
# result may not match any color in `m`
colorVariation(m, method = 'centroid')
#> [1] 12.92885
#> attr(,"centroid")
#> [1] "5Y 4/4"
# deviation from a known reference
colorVariation(m, method = 'reference', ref = '10YR 2/1')
#> [1] 24.34378
# L1-median (requires Gmedian package) like 'centroid'
# more robust to outliers
# result will usually be very close to a color in `m`
if(requireNamespace('Gmedian')) {
colorVariation(m, method = 'L1')
}
#> Loading required namespace: Gmedian
#> [1] 14.70739
#> attr(,"L1")
#> [1] "10YR 3/4"
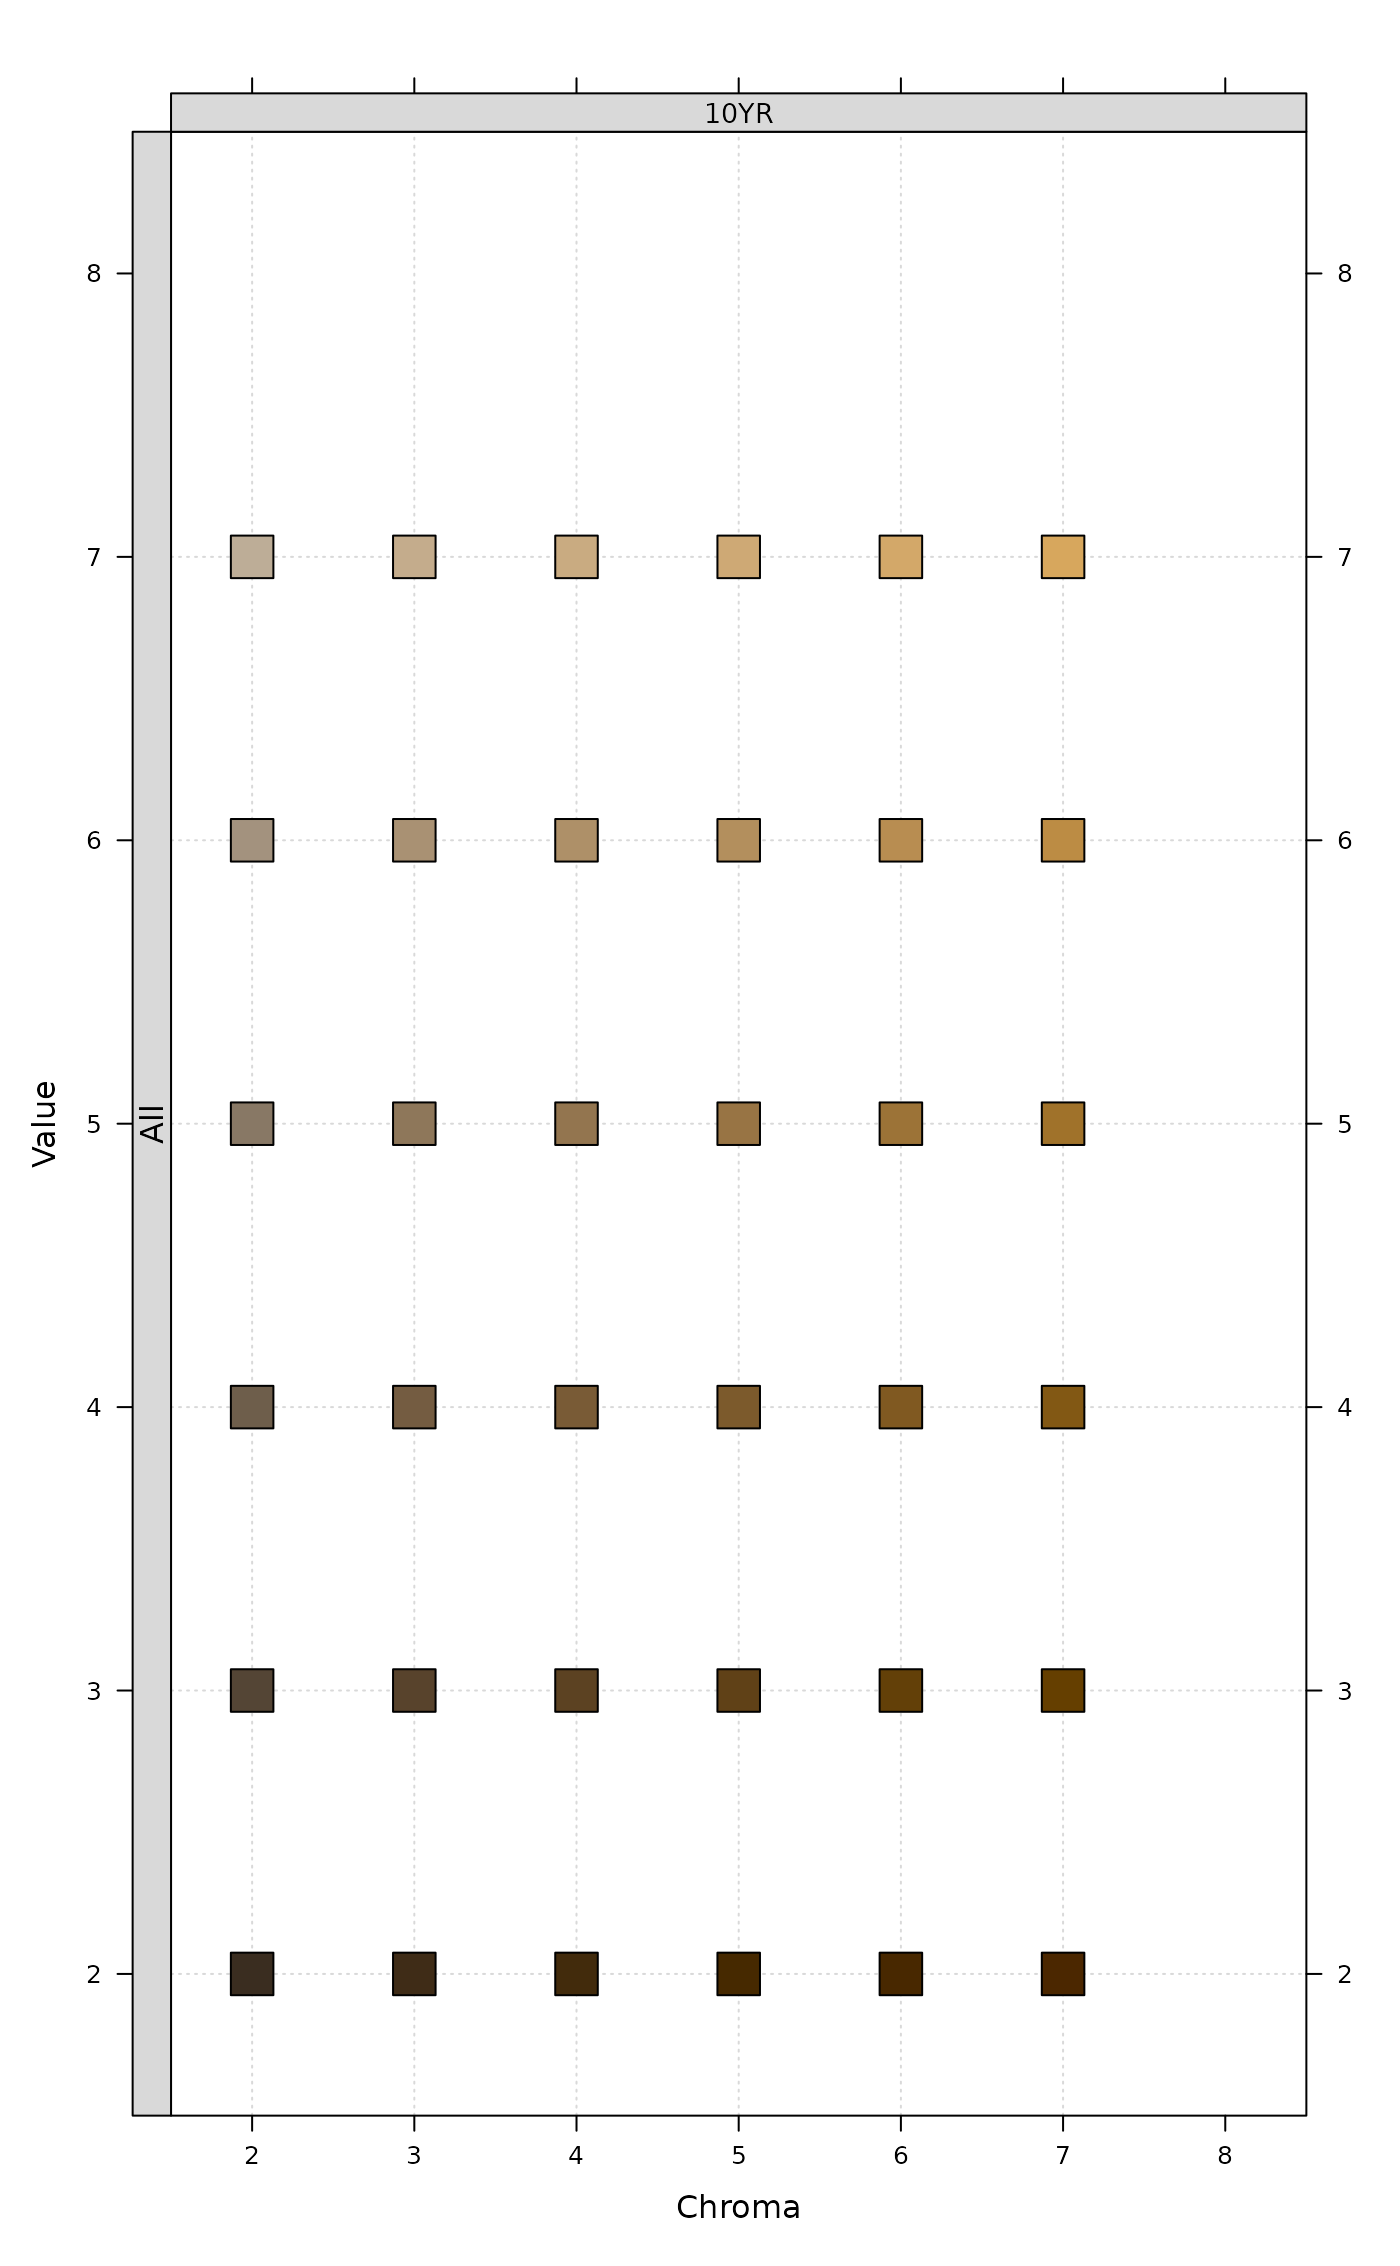
# compare methods using a range of colors on a
# single hue page
x <- expand.grid(
hue = '10YR',
value = 2:7,
chroma = 2:7
)
x$m <- sprintf("%s %s/%s", x$hue, x$value, x$chroma)
colorChart(x$m)
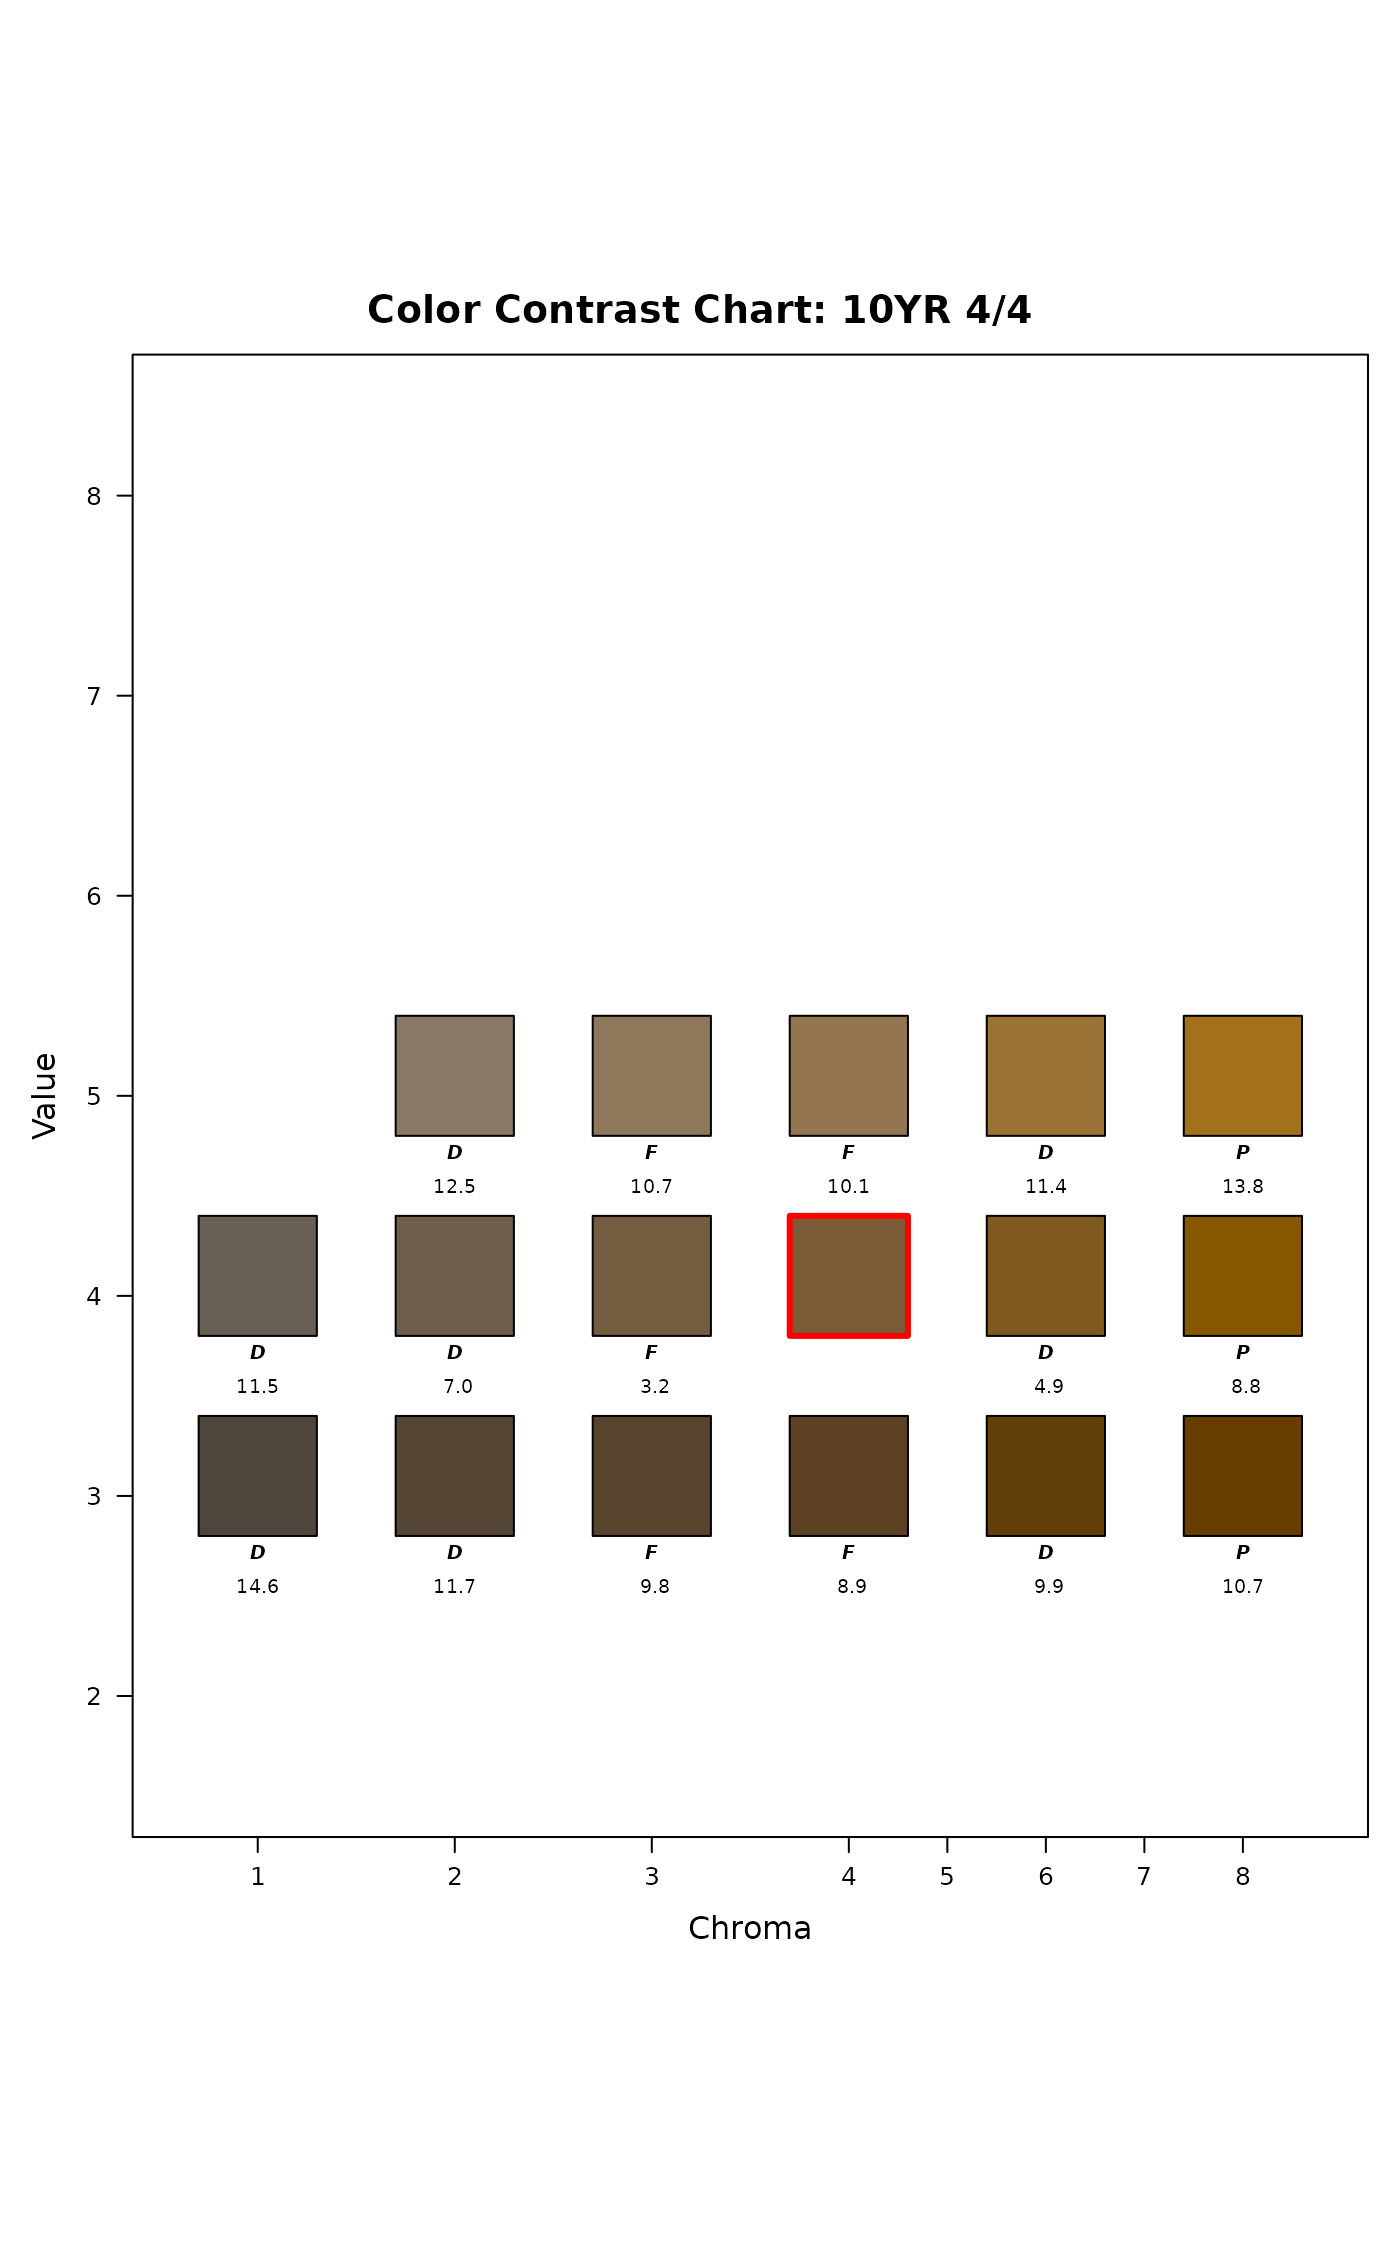
 (v <- colorVariation(x$m, method = 'centroid'))
#> [1] 15.43209
#> attr(,"centroid")
#> [1] "10YR 4/4"
contrastChart(attr(v, 'centroid'), hues = x$hue[1], thresh = v)
(v <- colorVariation(x$m, method = 'centroid'))
#> [1] 15.43209
#> attr(,"centroid")
#> [1] "10YR 4/4"
contrastChart(attr(v, 'centroid'), hues = x$hue[1], thresh = v)
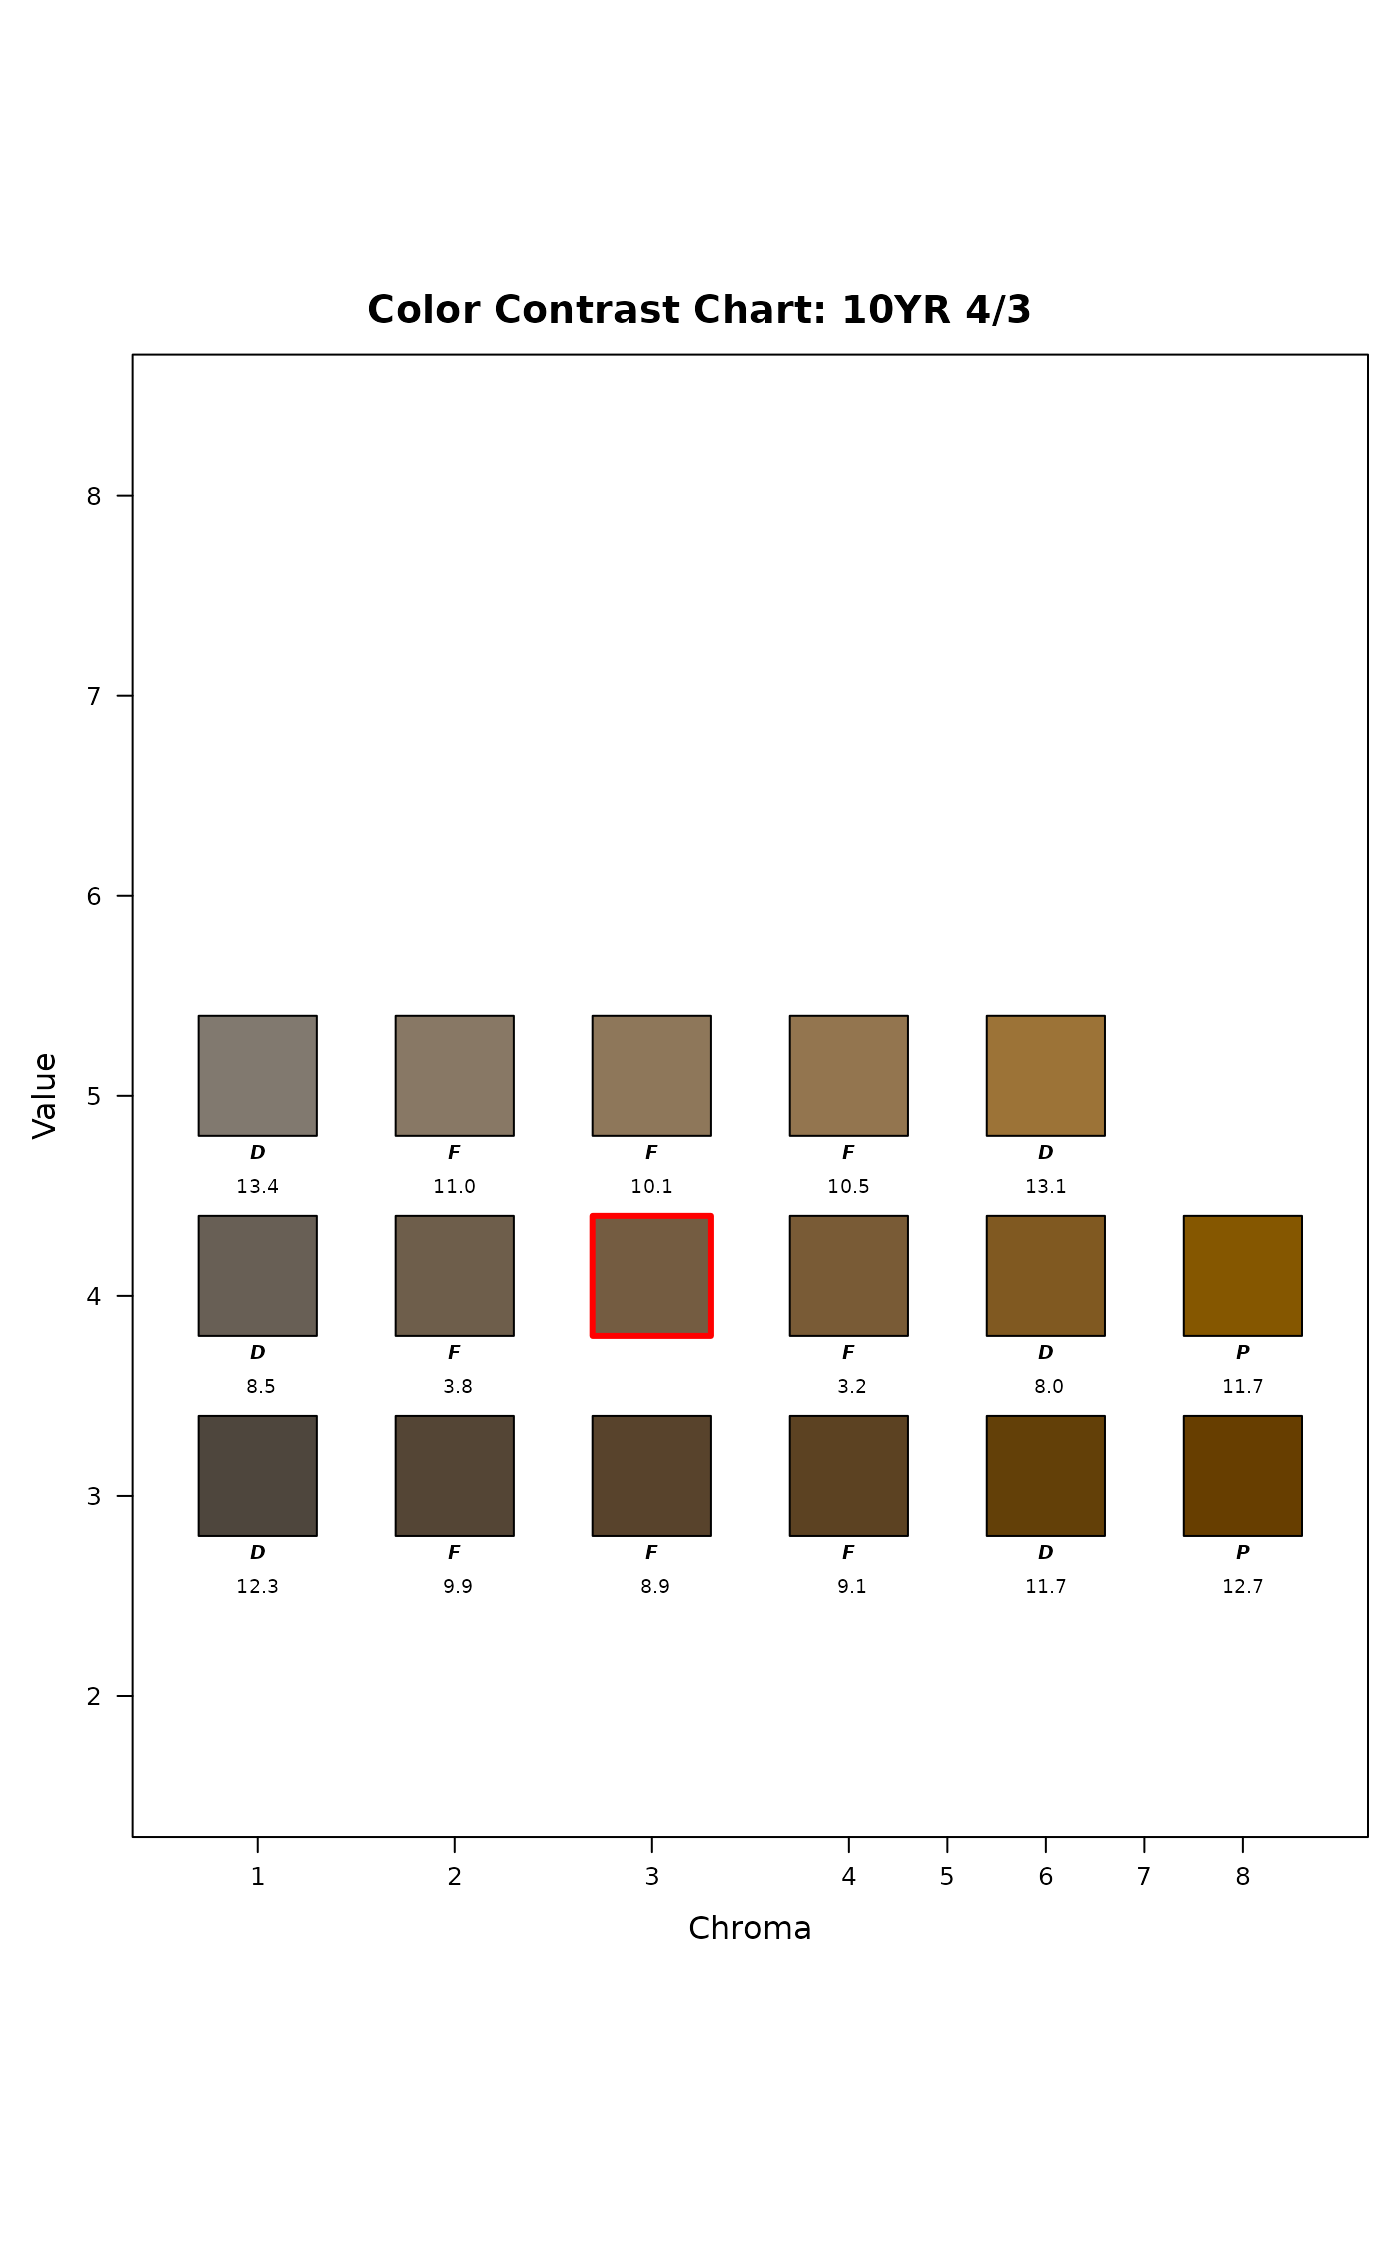
 if(requireNamespace('Gmedian')) {
(v <- colorVariation(x$m, method = 'L1'))
contrastChart(attr(v, 'L1'), hues = x$hue[1], thresh = v)
}
if(requireNamespace('Gmedian')) {
(v <- colorVariation(x$m, method = 'L1'))
contrastChart(attr(v, 'L1'), hues = x$hue[1], thresh = v)
}
 # attempt to simulate colors from a group centroid
if (FALSE) { # \dontrun{
v <- colorVariation(x$m, method = 'centroid')
s <- simulateColor(
method = 'dE00',
n = 200,
parameters = list(m = attr(v, 'centroid'), thresh = v * 1.96, hues = x$hue[1])
)
colorChart(s[[1]])
} # }
# attempt to simulate colors from a group centroid
if (FALSE) { # \dontrun{
v <- colorVariation(x$m, method = 'centroid')
s <- simulateColor(
method = 'dE00',
n = 200,
parameters = list(m = attr(v, 'centroid'), thresh = v * 1.96, hues = x$hue[1])
)
colorChart(s[[1]])
} # }