Visualize soil colors in Munsell notation according to within-group frequency.
Source:R/colorChart.R
colorChart.RdVisualize soil colors in Munsell notation according to within-group frequency.
Arguments
- m
character vector of color in Munsell notation ('10YR 4/6')
- g
factor describing group membership, typically a generalization of horizon designation, default value will generate a fake grouping that covers all of the colors in
m- size
logical, encode group-wise frequency with chip size
- annotate
logical, annotate color chip frequency
- launderColors
logical, fix common errors with encoding neutral colors, see
launderMunsell()- chip.cex
scaling factor applied to each color chip
- chip.cex.min
lower limit for color chip frequency depiction
- chip.cex.max
lower limit for color chip frequency depiction
- chip.border.col
color for chip borders (outline)
- annotate.cex
scaling factor for chip frequency annotation
- annotate.type
character, within-group
countorpercentage- threshold
numeric within 0-1, color chips with proportion
< thresholdare removed
Examples
library(lattice)
# two hue pages
ric <- expand.grid(
hue = c('5YR', '7.5YR'),
value = 2:8,
chroma = 2:8
)
# combine hue, value, chroma into standard Munsell notation
ric <- formatMunsell(ric$hue, ric$value, ric$chroma)
# note that chip frequency-based size is disabled
# because all chips have equal frequency
colorChart(ric, chip.cex = 4, size = TRUE)
 # annotation of frequency
colorChart(ric, chip.cex = 4, annotate = TRUE)
# annotation of frequency
colorChart(ric, chip.cex = 4, annotate = TRUE)
 # bootstrap to larger size
ric.big <- sample(ric, size = 100, replace = TRUE)
# frequency can be encoded in size
colorChart(ric.big, chip.cex = 3)
# bootstrap to larger size
ric.big <- sample(ric, size = 100, replace = TRUE)
# frequency can be encoded in size
colorChart(ric.big, chip.cex = 3)
 colorChart(ric.big, chip.cex = 5, annotate = TRUE)
 # constant size
colorChart(ric.big, chip.cex = 3, size = FALSE)
# constant size
colorChart(ric.big, chip.cex = 3, size = FALSE)
 colorChart(ric.big, chip.cex = 3, size = FALSE, chip.border.col = 'NA')
 # simulate colors based dE00 thresholding
p <- list(
list(m = '10YR 4/4', thresh = 10, hues = c('10YR', '7.5YR'))
)
# perform 500 simulations
s <- simulateColor(method = 'dE00', n = 500, parameters = p)
# result is a list, use the first element
colorChart(s[[1]], chip.cex = 4)
# simulate colors based dE00 thresholding
p <- list(
list(m = '10YR 4/4', thresh = 10, hues = c('10YR', '7.5YR'))
)
# perform 500 simulations
s <- simulateColor(method = 'dE00', n = 500, parameters = p)
# result is a list, use the first element
colorChart(s[[1]], chip.cex = 4)
 # increase the possible range of color chip sizes
colorChart(s[[1]], chip.cex = 4, chip.cex.min = 0.01, chip.cex.max = 2)
# increase the possible range of color chip sizes
colorChart(s[[1]], chip.cex = 4, chip.cex.min = 0.01, chip.cex.max = 2)
 # demonstrate support for neutral chips
N <- sprintf('N %s/', 2:8)
cols <- c(rep(N, times = 5), ric.big)
# note special panel used to show neutral chips
colorChart(cols, size = FALSE, annotate = TRUE)
# demonstrate support for neutral chips
N <- sprintf('N %s/', 2:8)
cols <- c(rep(N, times = 5), ric.big)
# note special panel used to show neutral chips
colorChart(cols, size = FALSE, annotate = TRUE)
 # filter proportions below given threshold
colorChart(cols, size = FALSE, annotate = TRUE, threshold = 0.01,
chip.cex = 4, annotate.type = 'percentage')
# filter proportions below given threshold
colorChart(cols, size = FALSE, annotate = TRUE, threshold = 0.01,
chip.cex = 4, annotate.type = 'percentage')
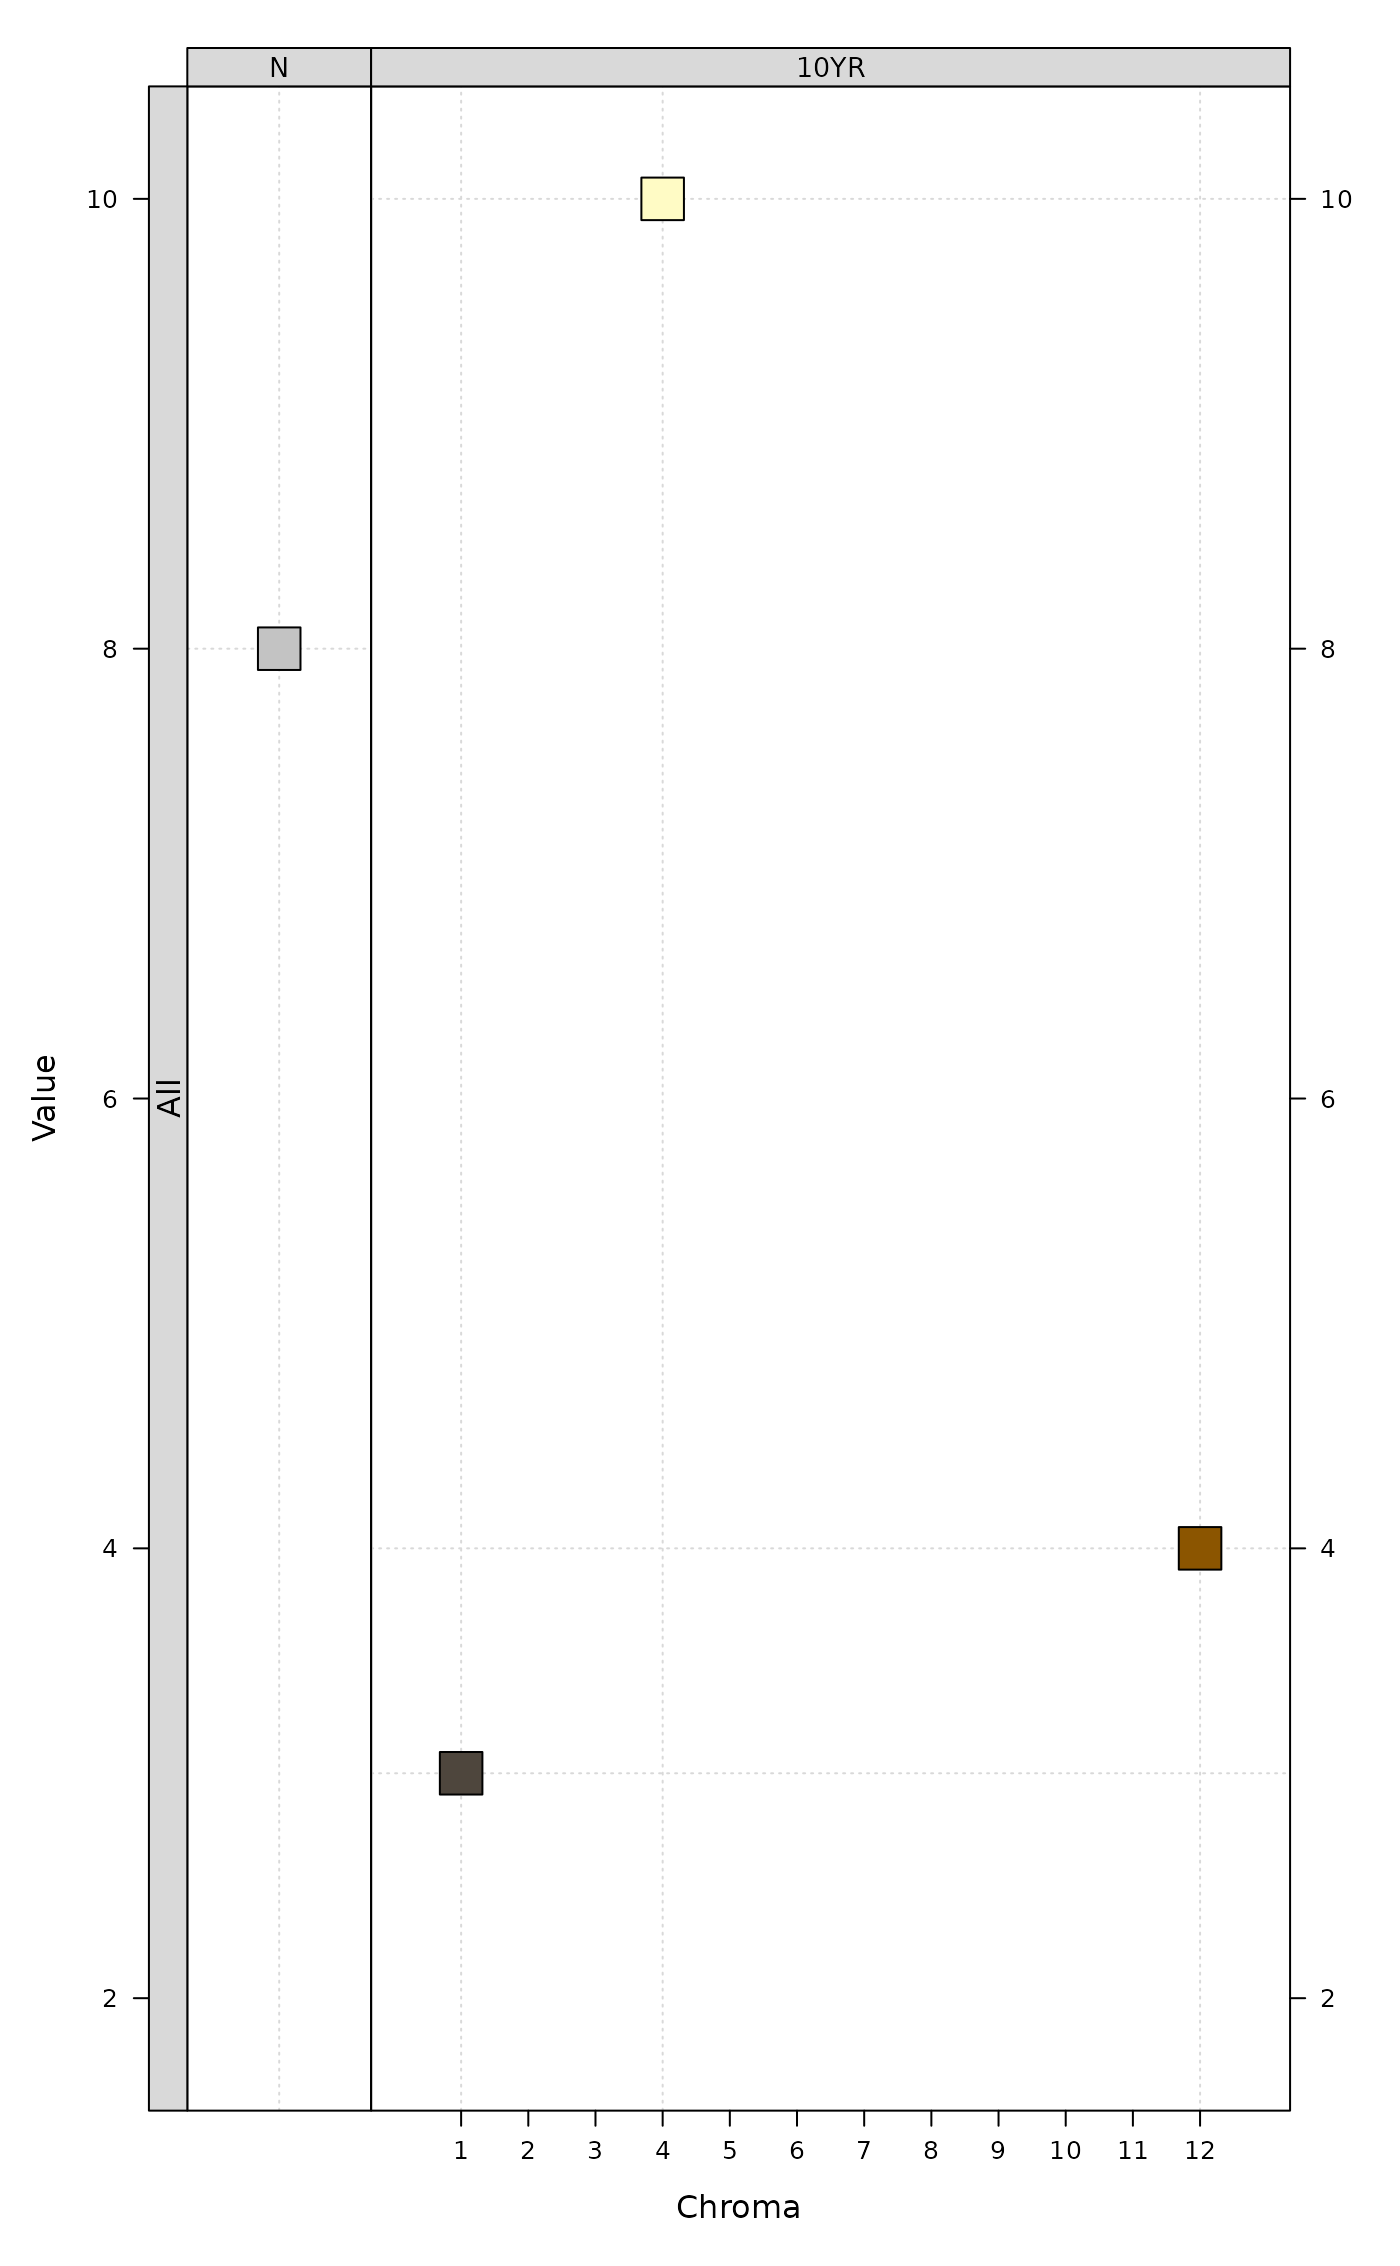
 # extreme values
colorChart(c('N 8/', '10YR 4/12', '10YR 3/1', '10YR 10/4'))
# extreme values
colorChart(c('N 8/', '10YR 4/12', '10YR 3/1', '10YR 10/4'))
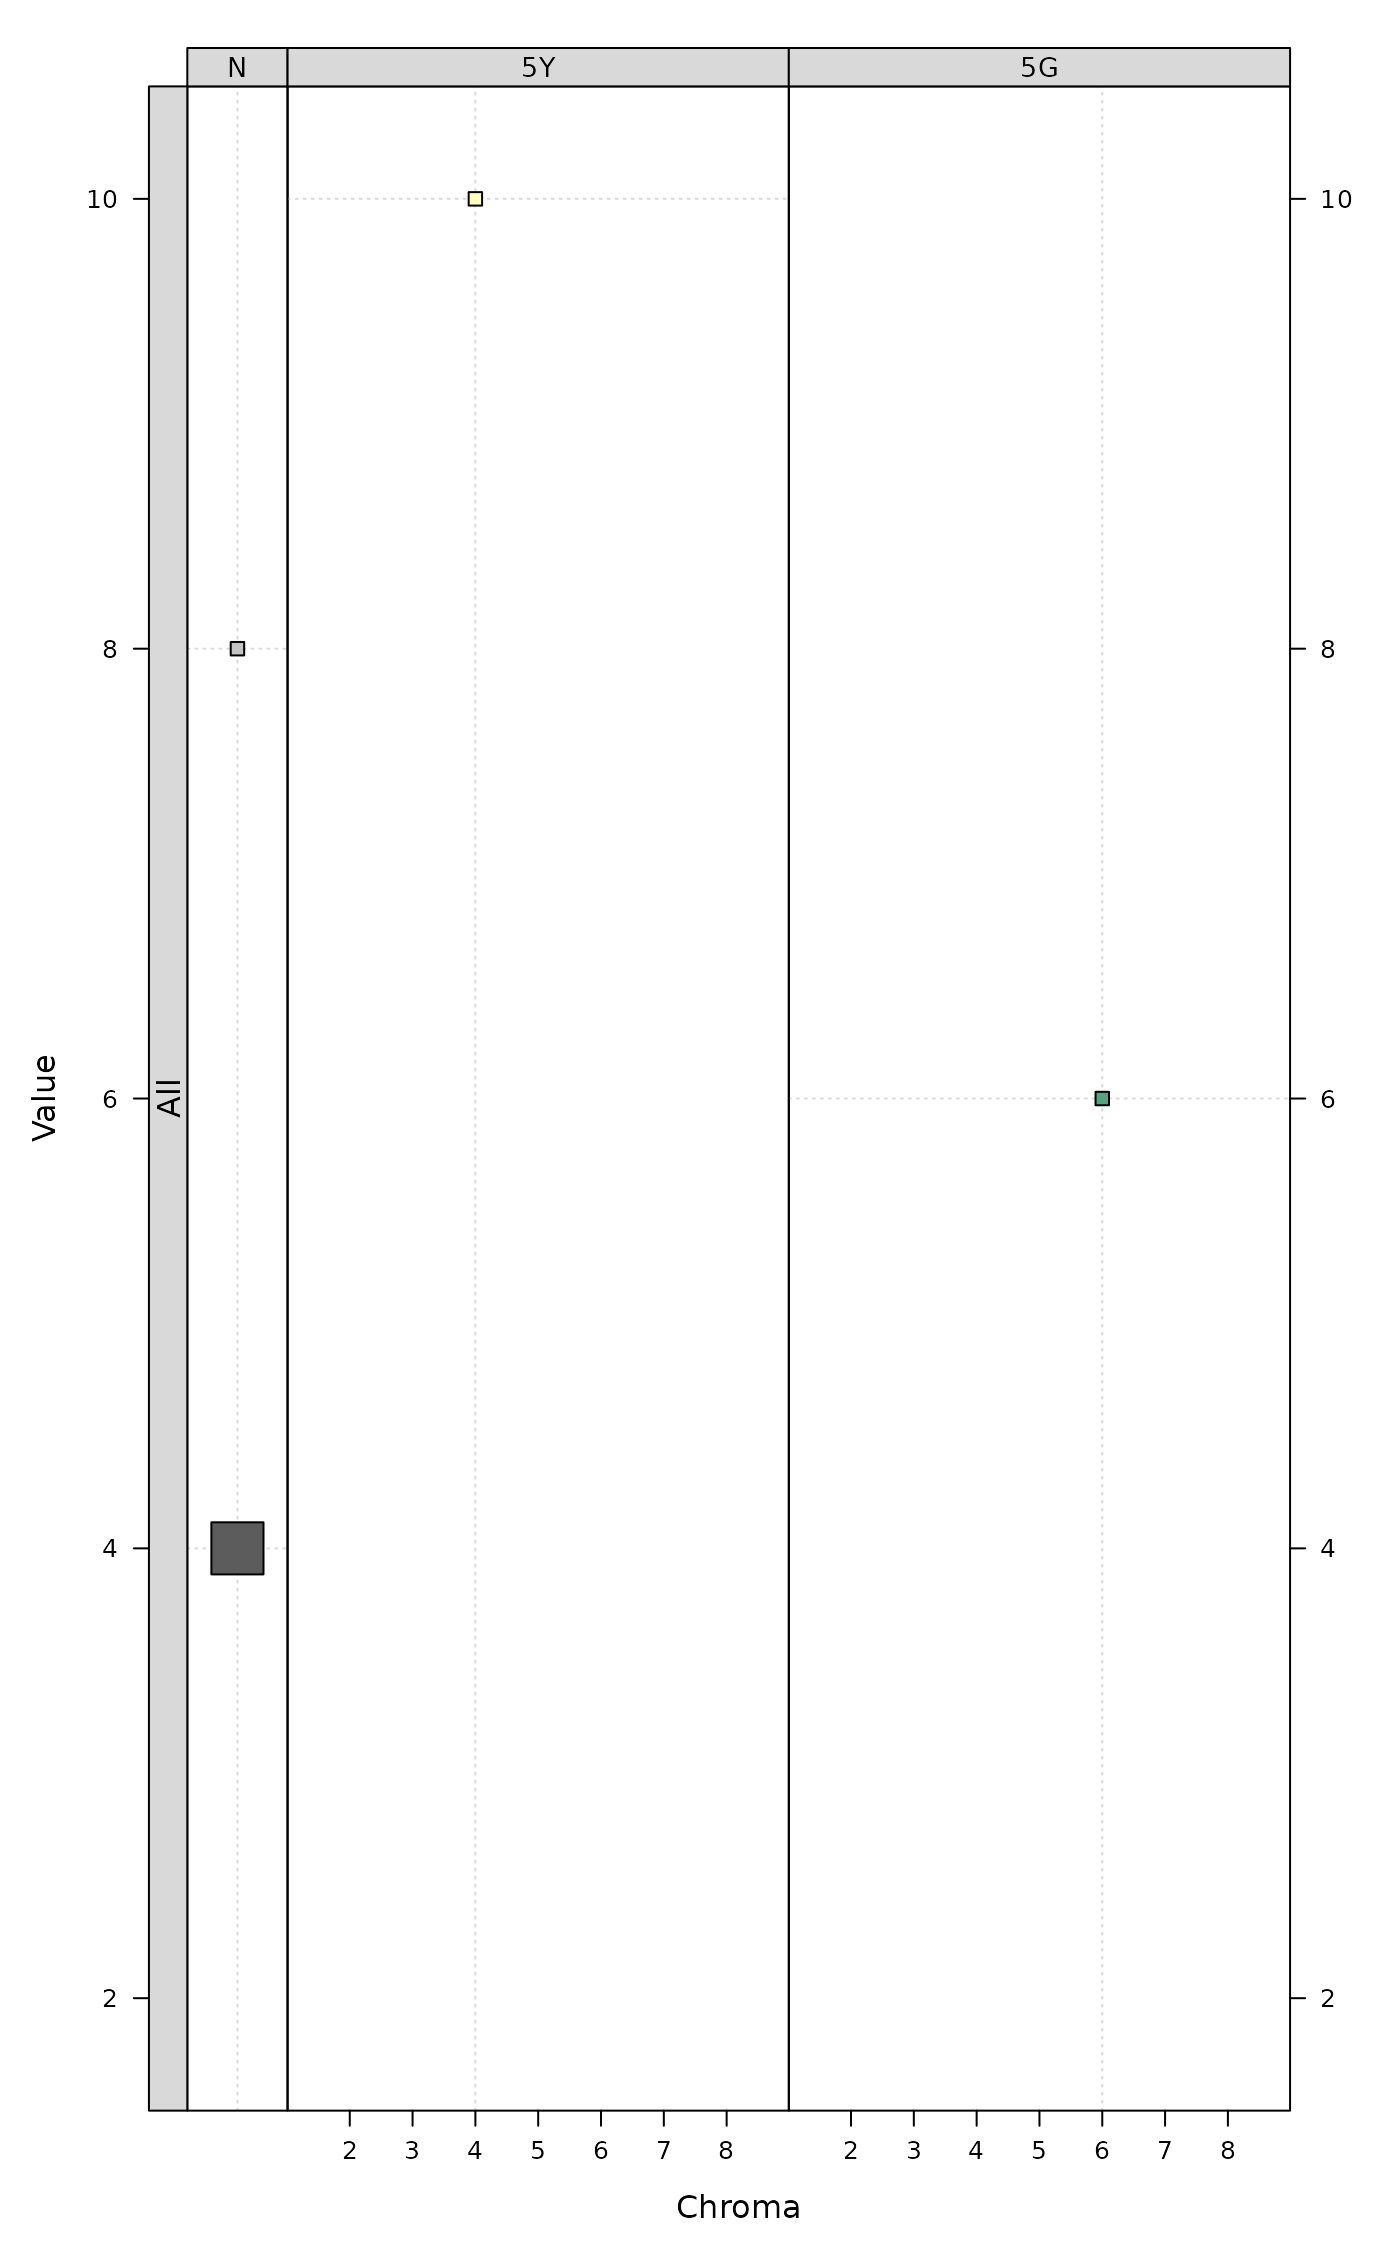
 # unusual notation, 10YR 4/0 --> effectively N 4/
colorChart(c('N 8/', 'N 4/', '10YR 4/0', '5G 6/6', '5Y 10/4'))
# unusual notation, 10YR 4/0 --> effectively N 4/
colorChart(c('N 8/', 'N 4/', '10YR 4/0', '5G 6/6', '5Y 10/4'))
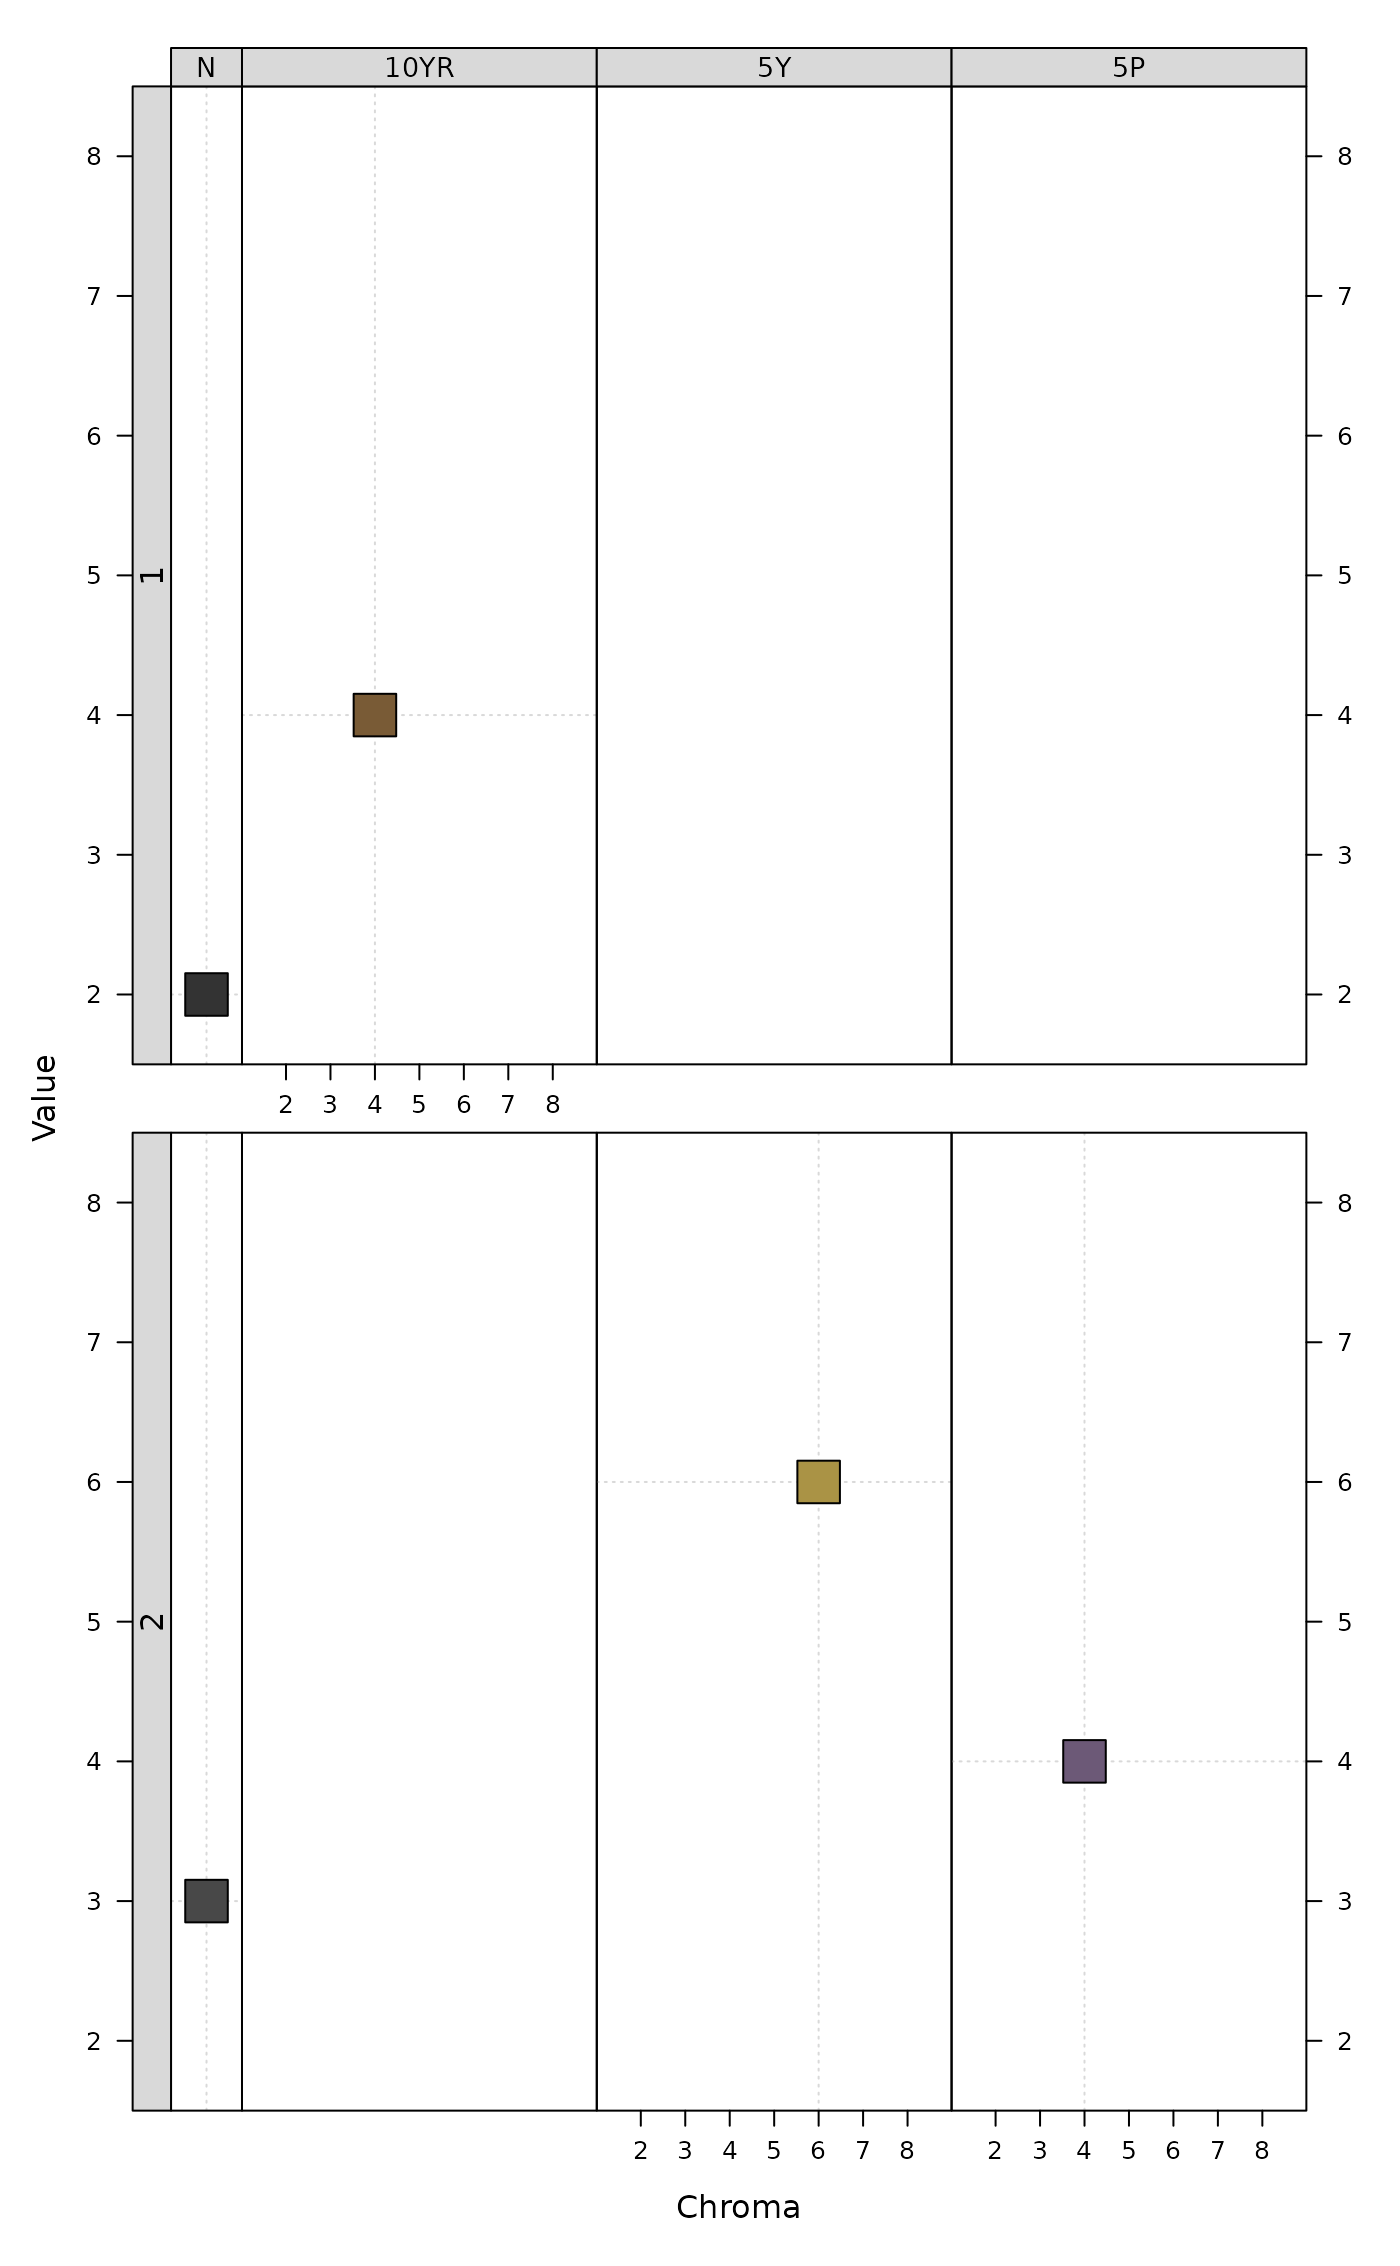
 # demonstrate groups
m <- c('10YR 4/4', 'N 2/', 'N 3/', '5Y 6/6', '5P 4/4')
g <- factor(c(1, 1, 2, 2, 2))
colorChart(m, g)
# demonstrate groups
m <- c('10YR 4/4', 'N 2/', 'N 3/', '5Y 6/6', '5P 4/4')
g <- factor(c(1, 1, 2, 2, 2))
colorChart(m, g)