Demonstration of Percentiles vs. Mean / SD
percentileDemo.RdThis function can be used to graphically demonstrate the relationship between distribution shape, an idealized normal distribution (based on sample mean and sd) shape, and measures of central tendency / spread.
percentileDemo(x, labels.signif = 3, pctile.color = "RoyalBlue",
mean.color = "Orange", range.color = "DarkRed",
hist.breaks = 30, boxp = FALSE, ...)
Arguments
- x
vector of values to summarize
- labels.signif
integer, number of significant digits to be used in figure annotation
- pctile.color
color used to demonstrate range from 10th to 90th percentiles
- mean.color
color used to specify mean +/- 2SD
- range.color
color used to specify data range
- hist.breaks
integer, number of suggested breaks to
hist- boxp
logical, add a box and whisker plot?
- ...
further arguments to
plot
Value
A 1-row matrix of summary stats is invisibly returned.
Note
This function is mainly for educational purposes.
Examples
if (requireNamespace("Hmisc")) {
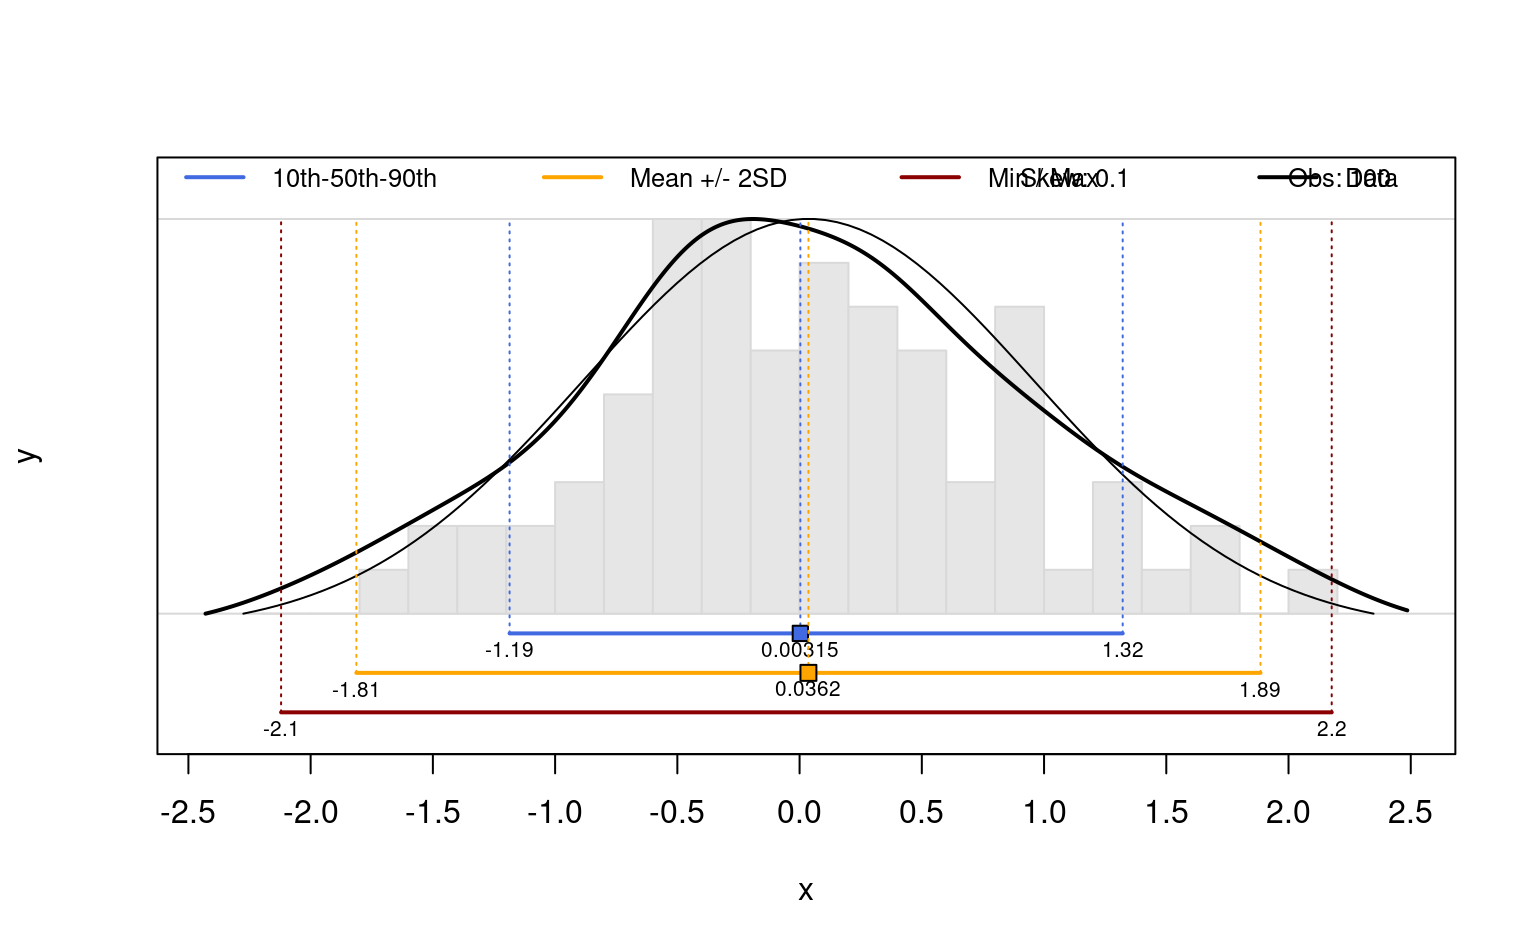
x <- rnorm(100)
percentileDemo(x)
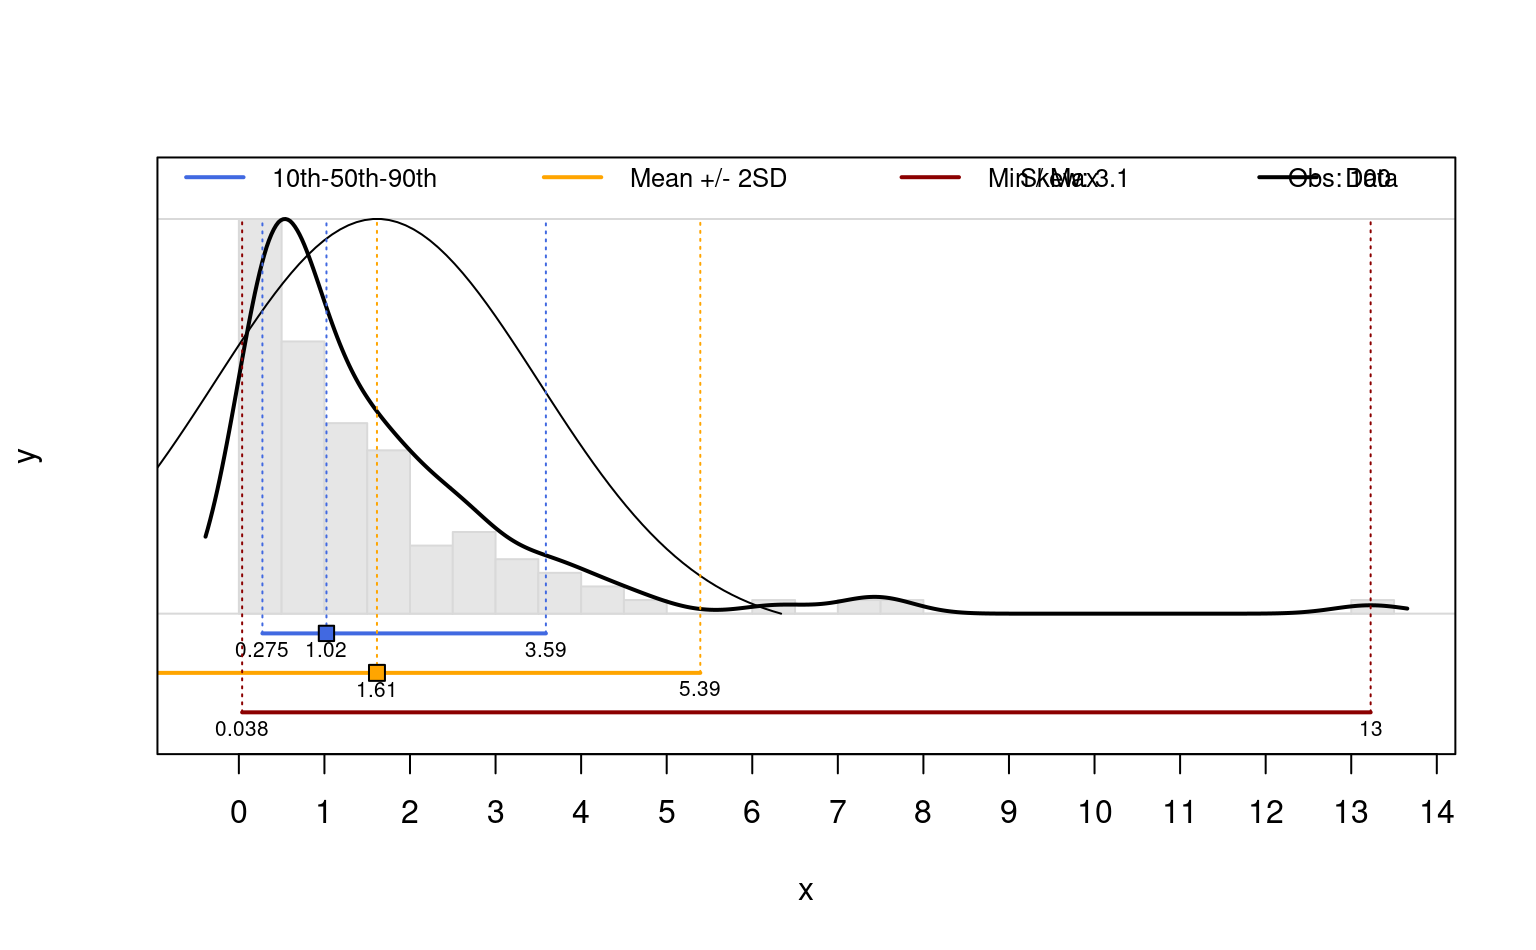
x <- rlnorm(100)
percentileDemo(x)
}
#> Loading required namespace: Hmisc