Graphical Description of US Soil Taxonomy Soil Temperature Regimes
Usage
STRplot(mast, msst, mwst, permafrost = FALSE, pt.cex = 2.75, leg.cex = 0.85)
Arguments
- mast
single value or vector of mean annual soil temperature (deg C)
- msst
single value or vector of mean summer soil temperature (deg C)
- mwst
single value of mean winter soil temperature (deg C)
- permafrost
logical: permafrost presence / absence
- pt.cex
symbol size
- leg.cex
legend size
References
Soil Survey Staff. 2015. Illustrated guide to soil taxonomy.
U.S. Department of Agriculture, Natural Resources Conservation Service,
National Soil Survey Center, Lincoln, Nebraska.
Examples
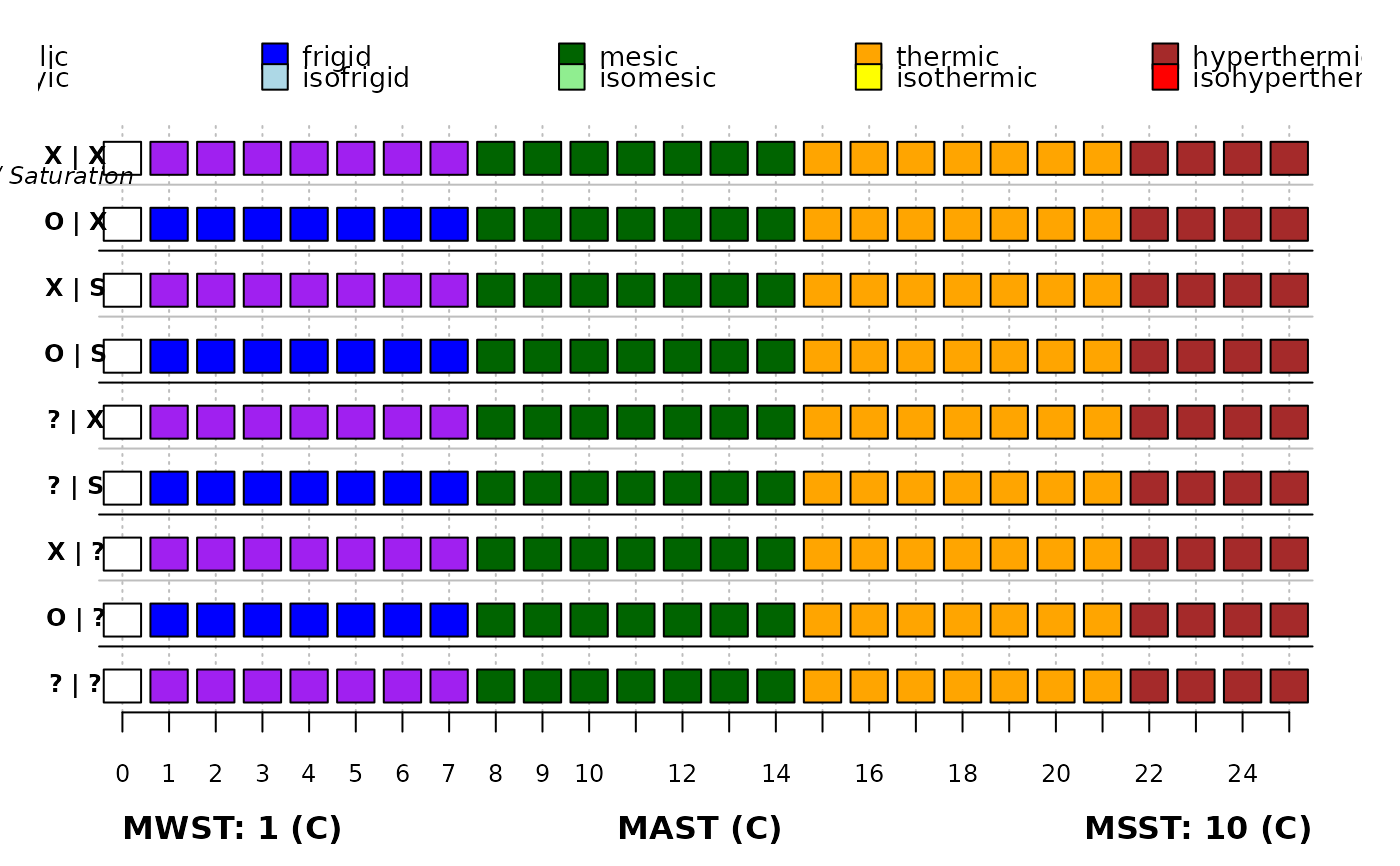
par(mar=c(4,1,0,1))
STRplot(mast = 0:25, msst = 10, mwst = 1)